Debug Node
The Debug Node allows inspection of the current payload and execution timing info at any point during a workflow. It is extremely useful when initially constructing a workflow to ensure sure that all the various components are acting on the payload as expected.

Node Properties
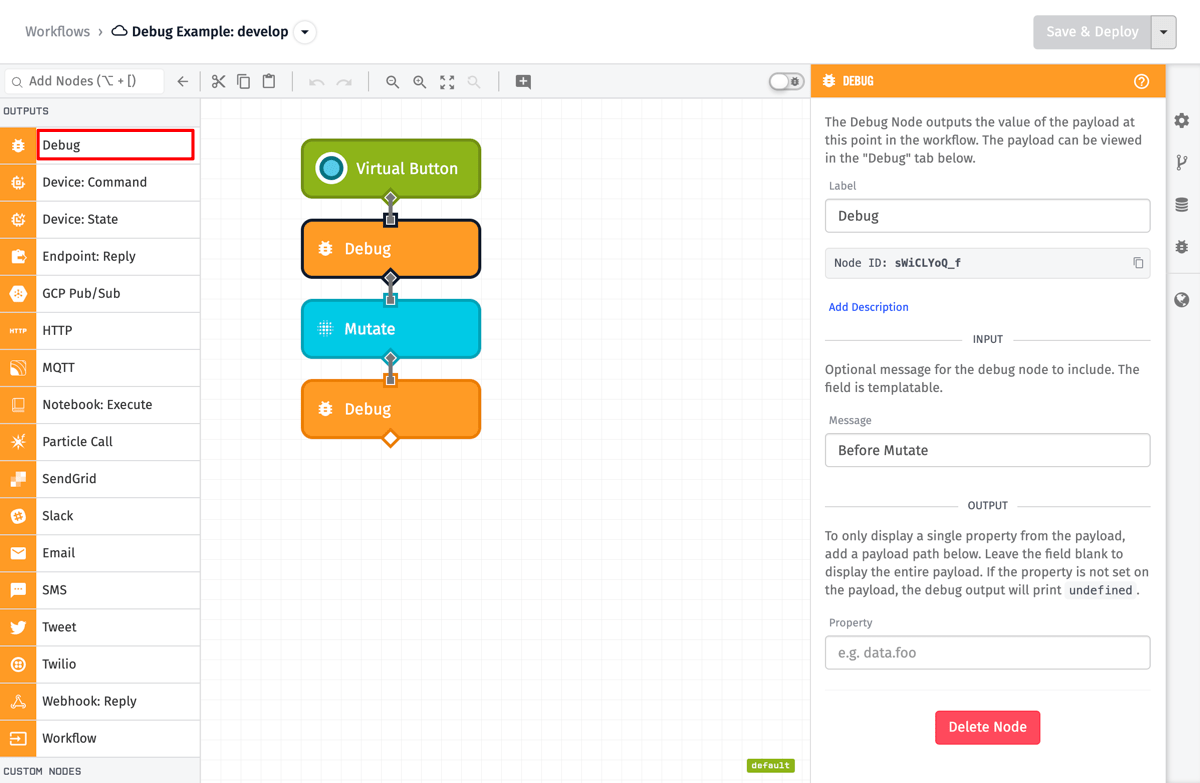
The Debug Node is very simple to configure - there are only two sections, and both are optional.
Note: The use of a Debug Node does not alter or mutate your workflow payload in any way. The presence or absence of a Debug Node will not alter how your workflow runs or the result.
Input
The Debug Node takes an optional message (a string template) to include in the debug messages that get displayed. In the above example, the message is "Before Mutate".
Output
The node also allows for only printing a single property from the payload, as defined by a payload path. If the property is defined in the configuration, and that property does not exist on the payload, the debug output will print undefined.
Viewing Debug Output
Whenever a workflow runs, and in the process that run passes through one or more Debug Nodes, the workflow run will be visualized two different ways.
Debug Panel
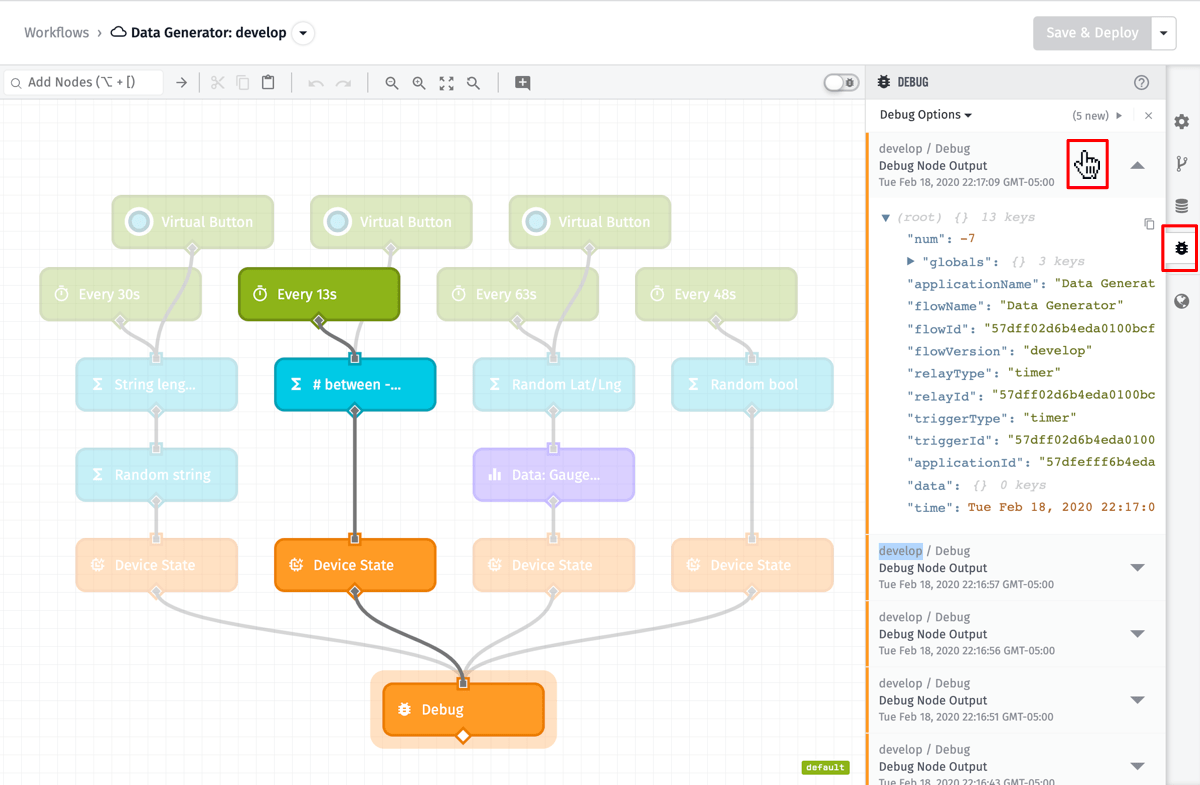
Every time a Debug Node is hit, the timestamp and payload value will be written as a new message in the Debug tab. New messages appear at the top of the list. If multiple Debug Nodes are hit as part of a single workflow run, each Debug Node will get an entry in the panel; this can be helpful in determining how your payload changes over the course of a run.
Note: In order to see the debug output for Edge Workflows and Embedded Workflows, you'll need to use the Live Look for a specific device.

To view that payload's path through the workflow run, hover your mouse over the debug message. You will see the nodes that were part of the run highlight, and the Debug Node that generated the message will be called out.
For more information on utilizing the debug panel, visit our debugging workflows documentation.
Live Stream
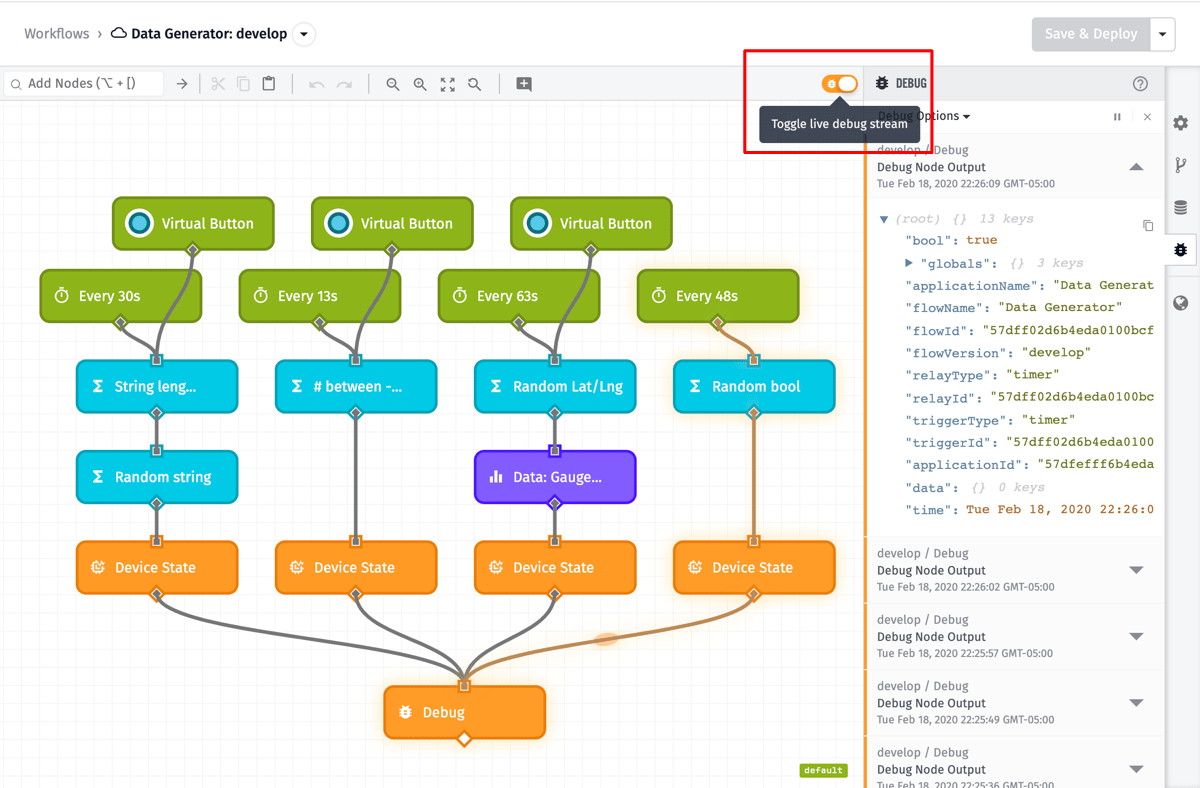
Optionally, you may also enable the Live Debug Stream by clicking the button in the top right corner of the workflow stage. When live streaming is enabled, you will see workflow runs highlight in real time as they fire.

Note: Should multiple workflow runs occur per second, some of the runs may not be visualized on the stage. Also, if you have unsaved changes in your workflow, live streams will automatically be disabled until the changes are saved.
Was this page helpful?
Still looking for help? You can also search the WEGnology Forums or submit your question there.