WEGnology Walkthrough
Don't have a device? No problem! This walkthrough allows you to experience many of the features in WEGnology by building a weather station dashboard.
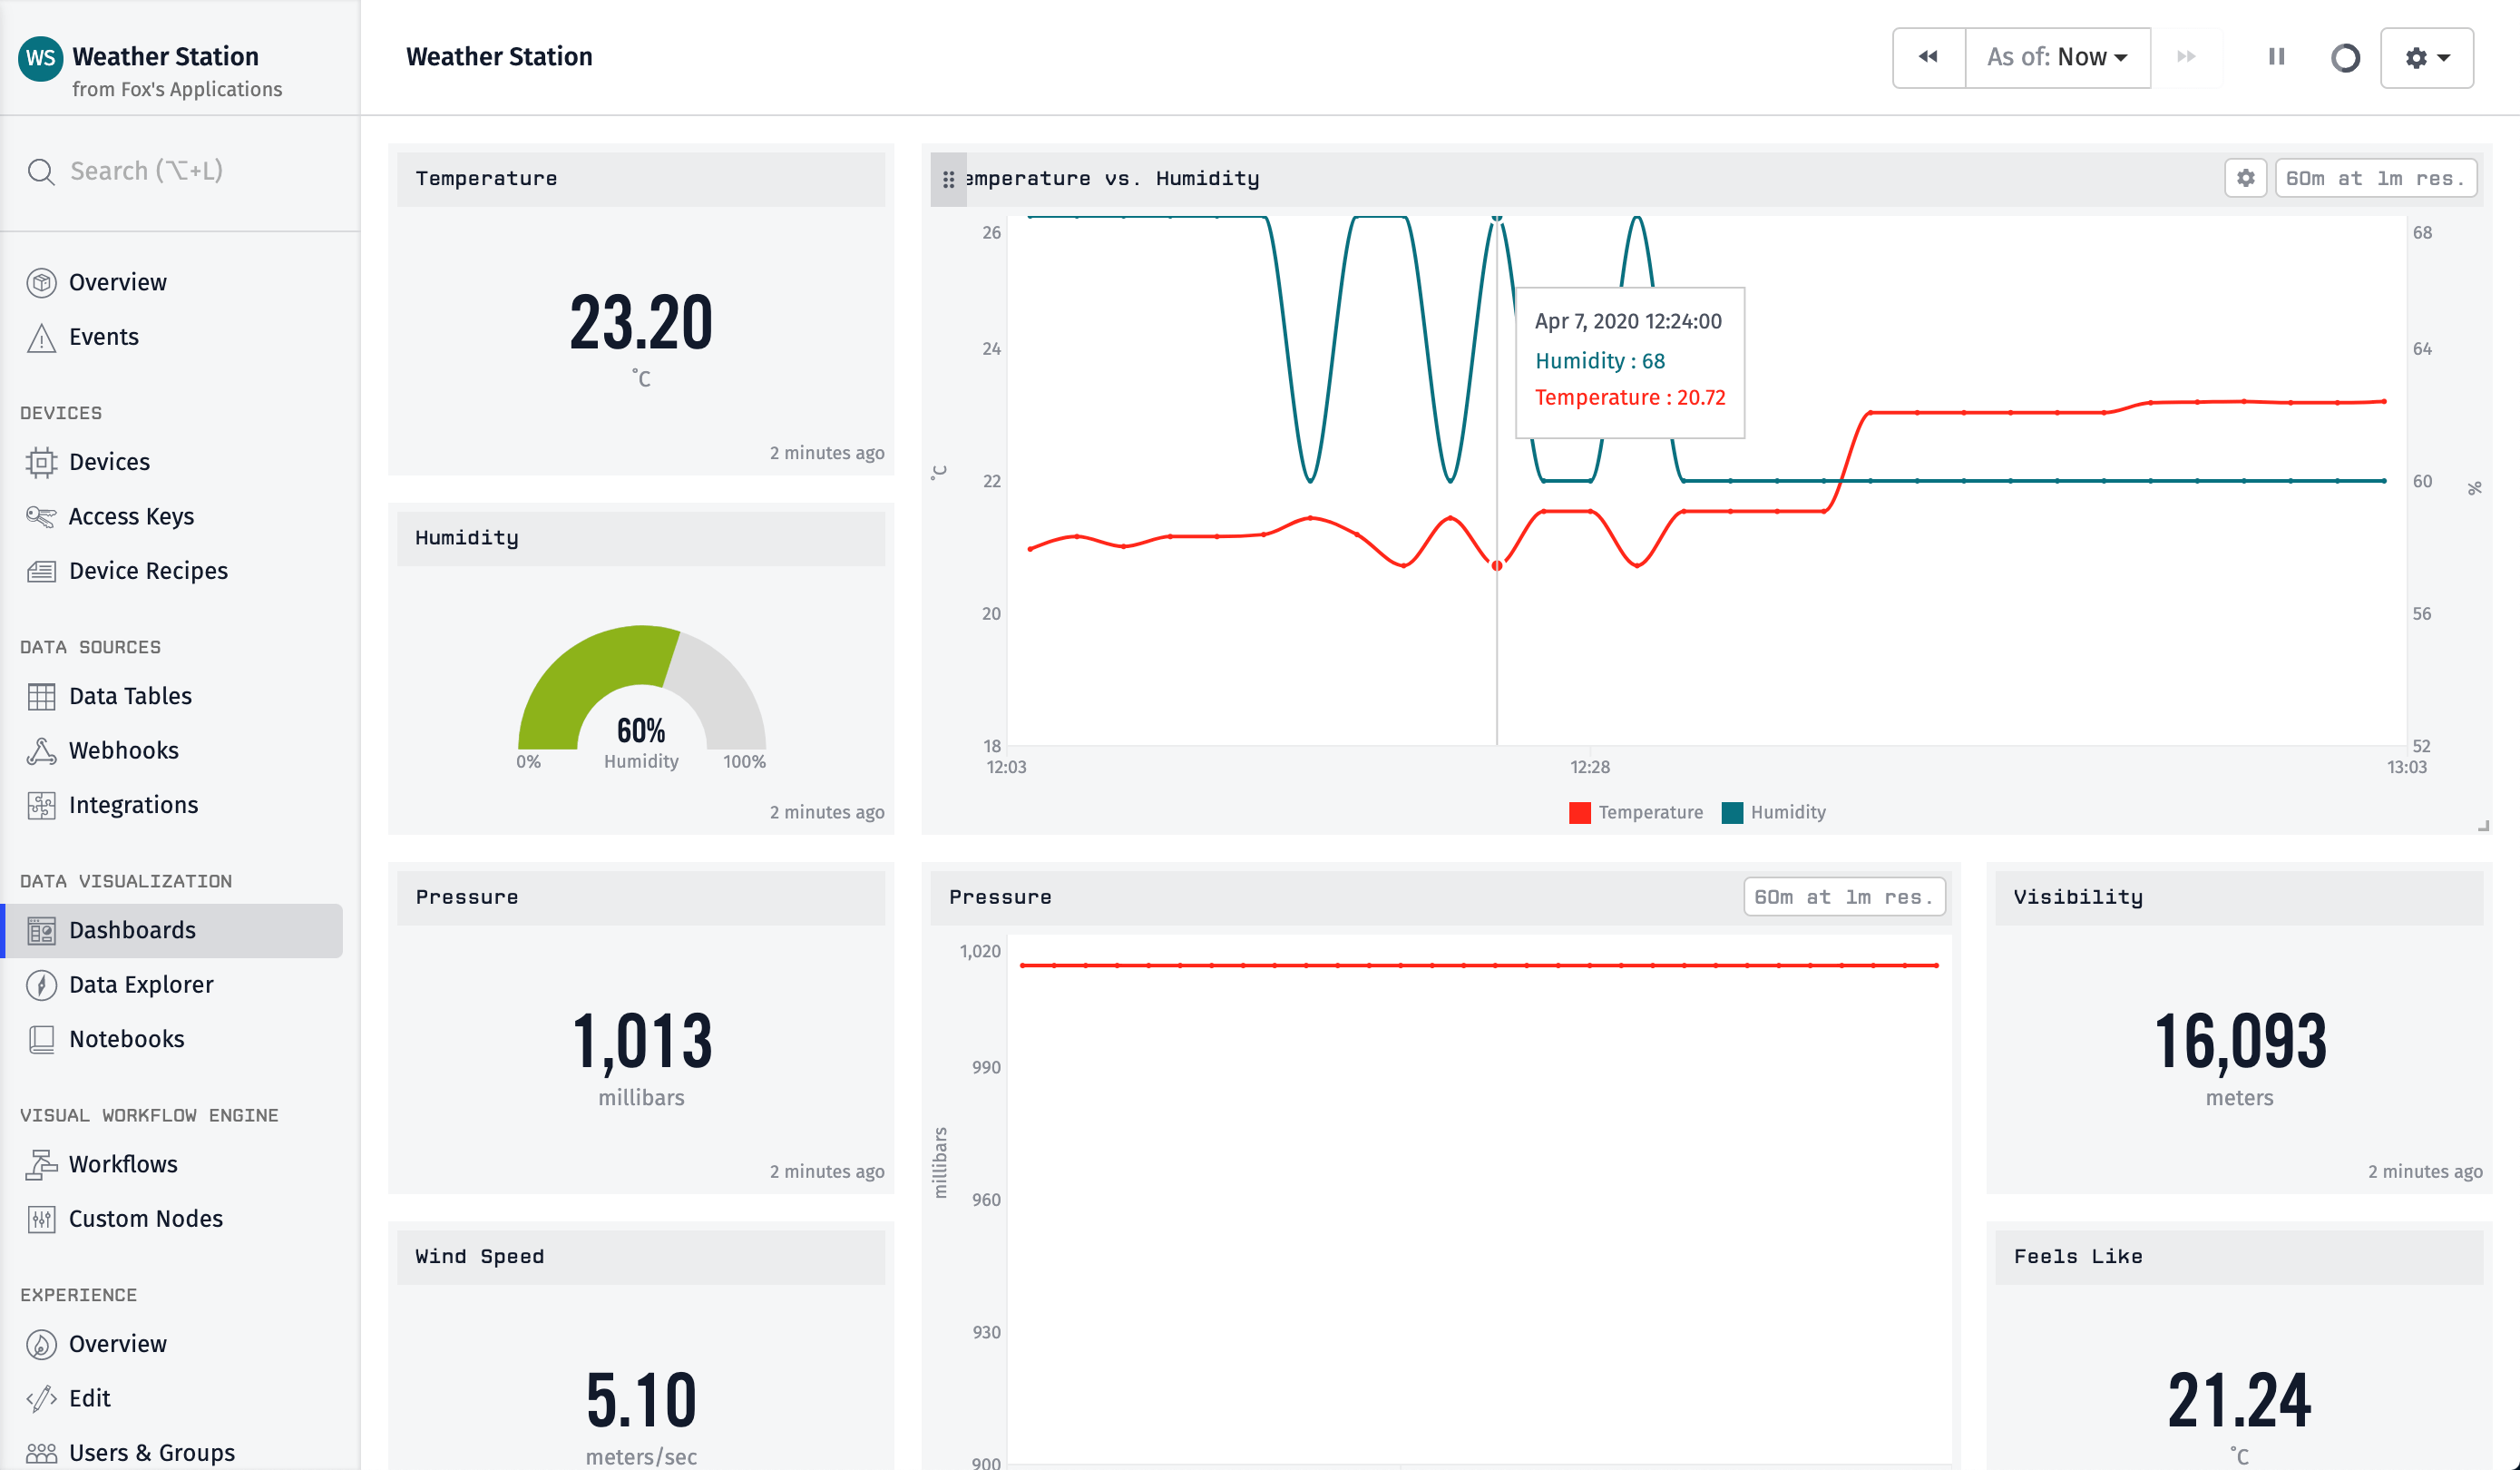
In a real implementation, you'd use sensors and hardware to capture the weather information and send that data to WEGnology using MQTT or HTTP. For this walkthrough, instead of real hardware, we use the OpenWeather API to simulate hardware that sends weather data.
Step 1: Sign up for OpenWeather API
OpenWeather is an API that provides a simple way to acquire weather data. The OpenWeather API is a separate, paid service. You may see the details of OpenWeather's pricing on their pricing page.
Sign up and get an API key for the OpenWeather API. Once you sign up you'll be provided an API key. Keep this handy for future steps.
Step 2: Create Application
If you don't have a WEGnology account, sign up. After creation, you'll be prompted to create your first Application. Select "Add Application".
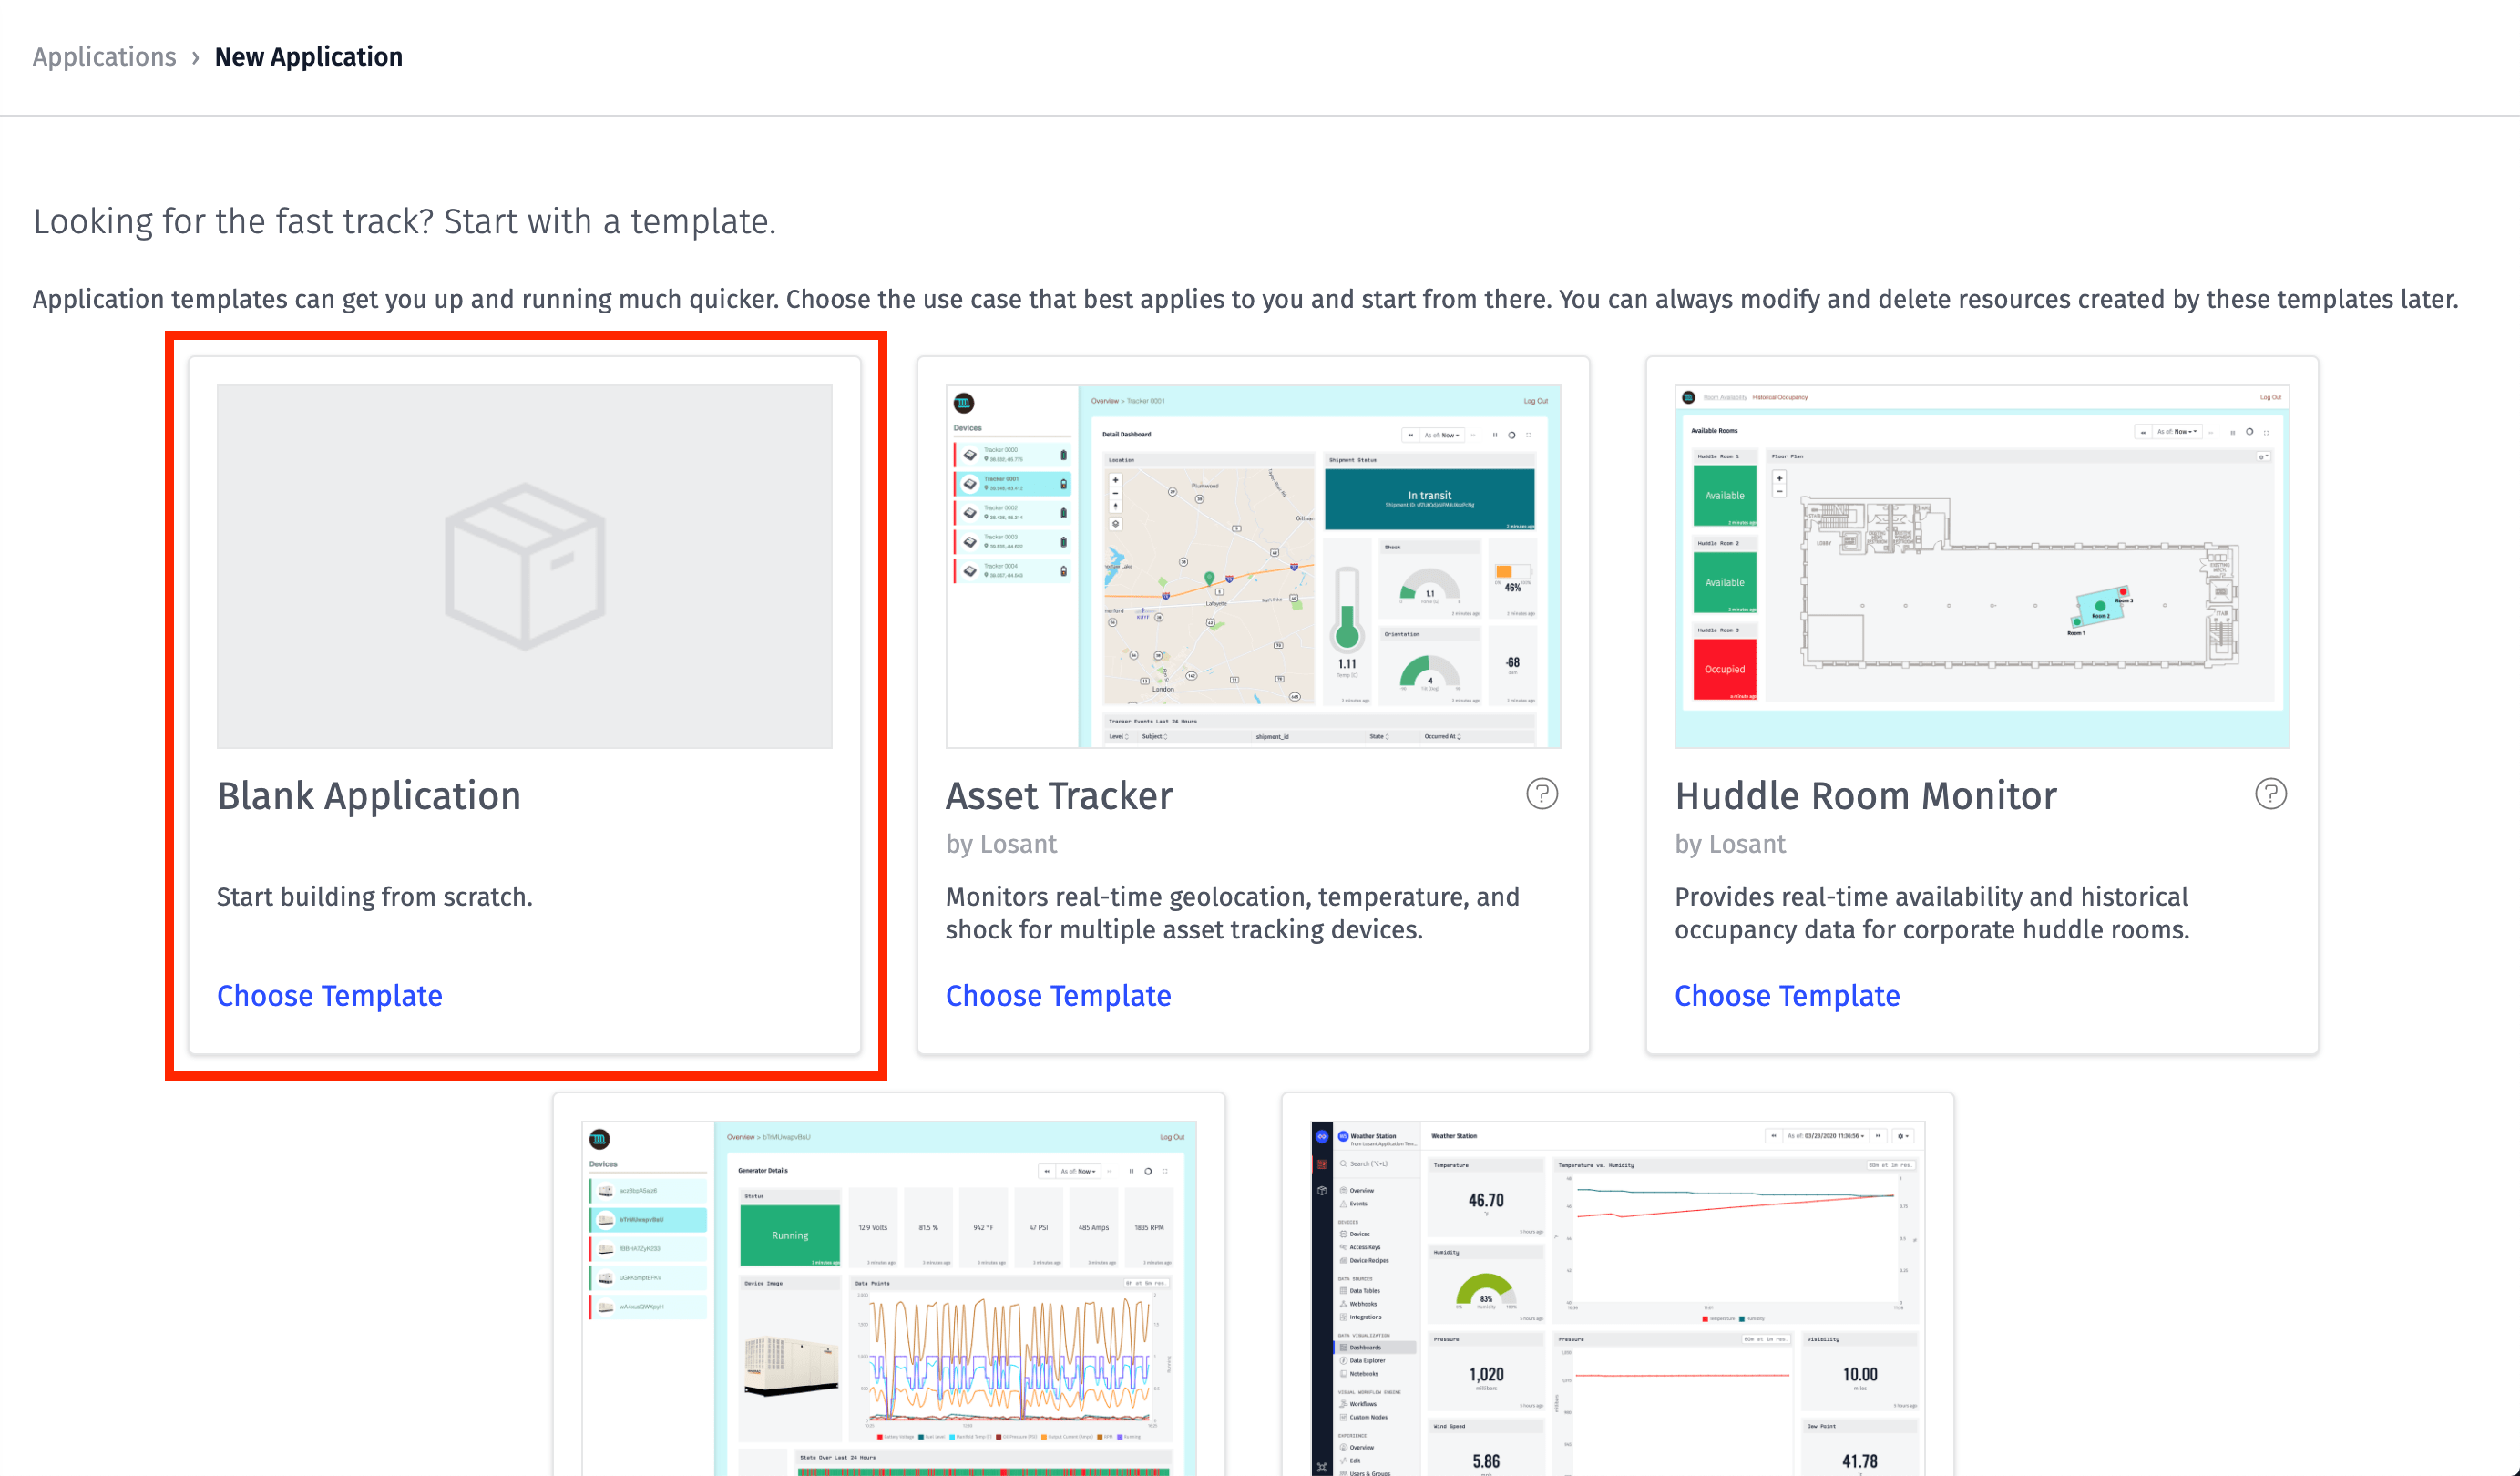
Next, you will see all of the Application Templates. Templates get you up and running quick by providing sample implementations you can use as the basis for your applications.
Select "Blank Application".
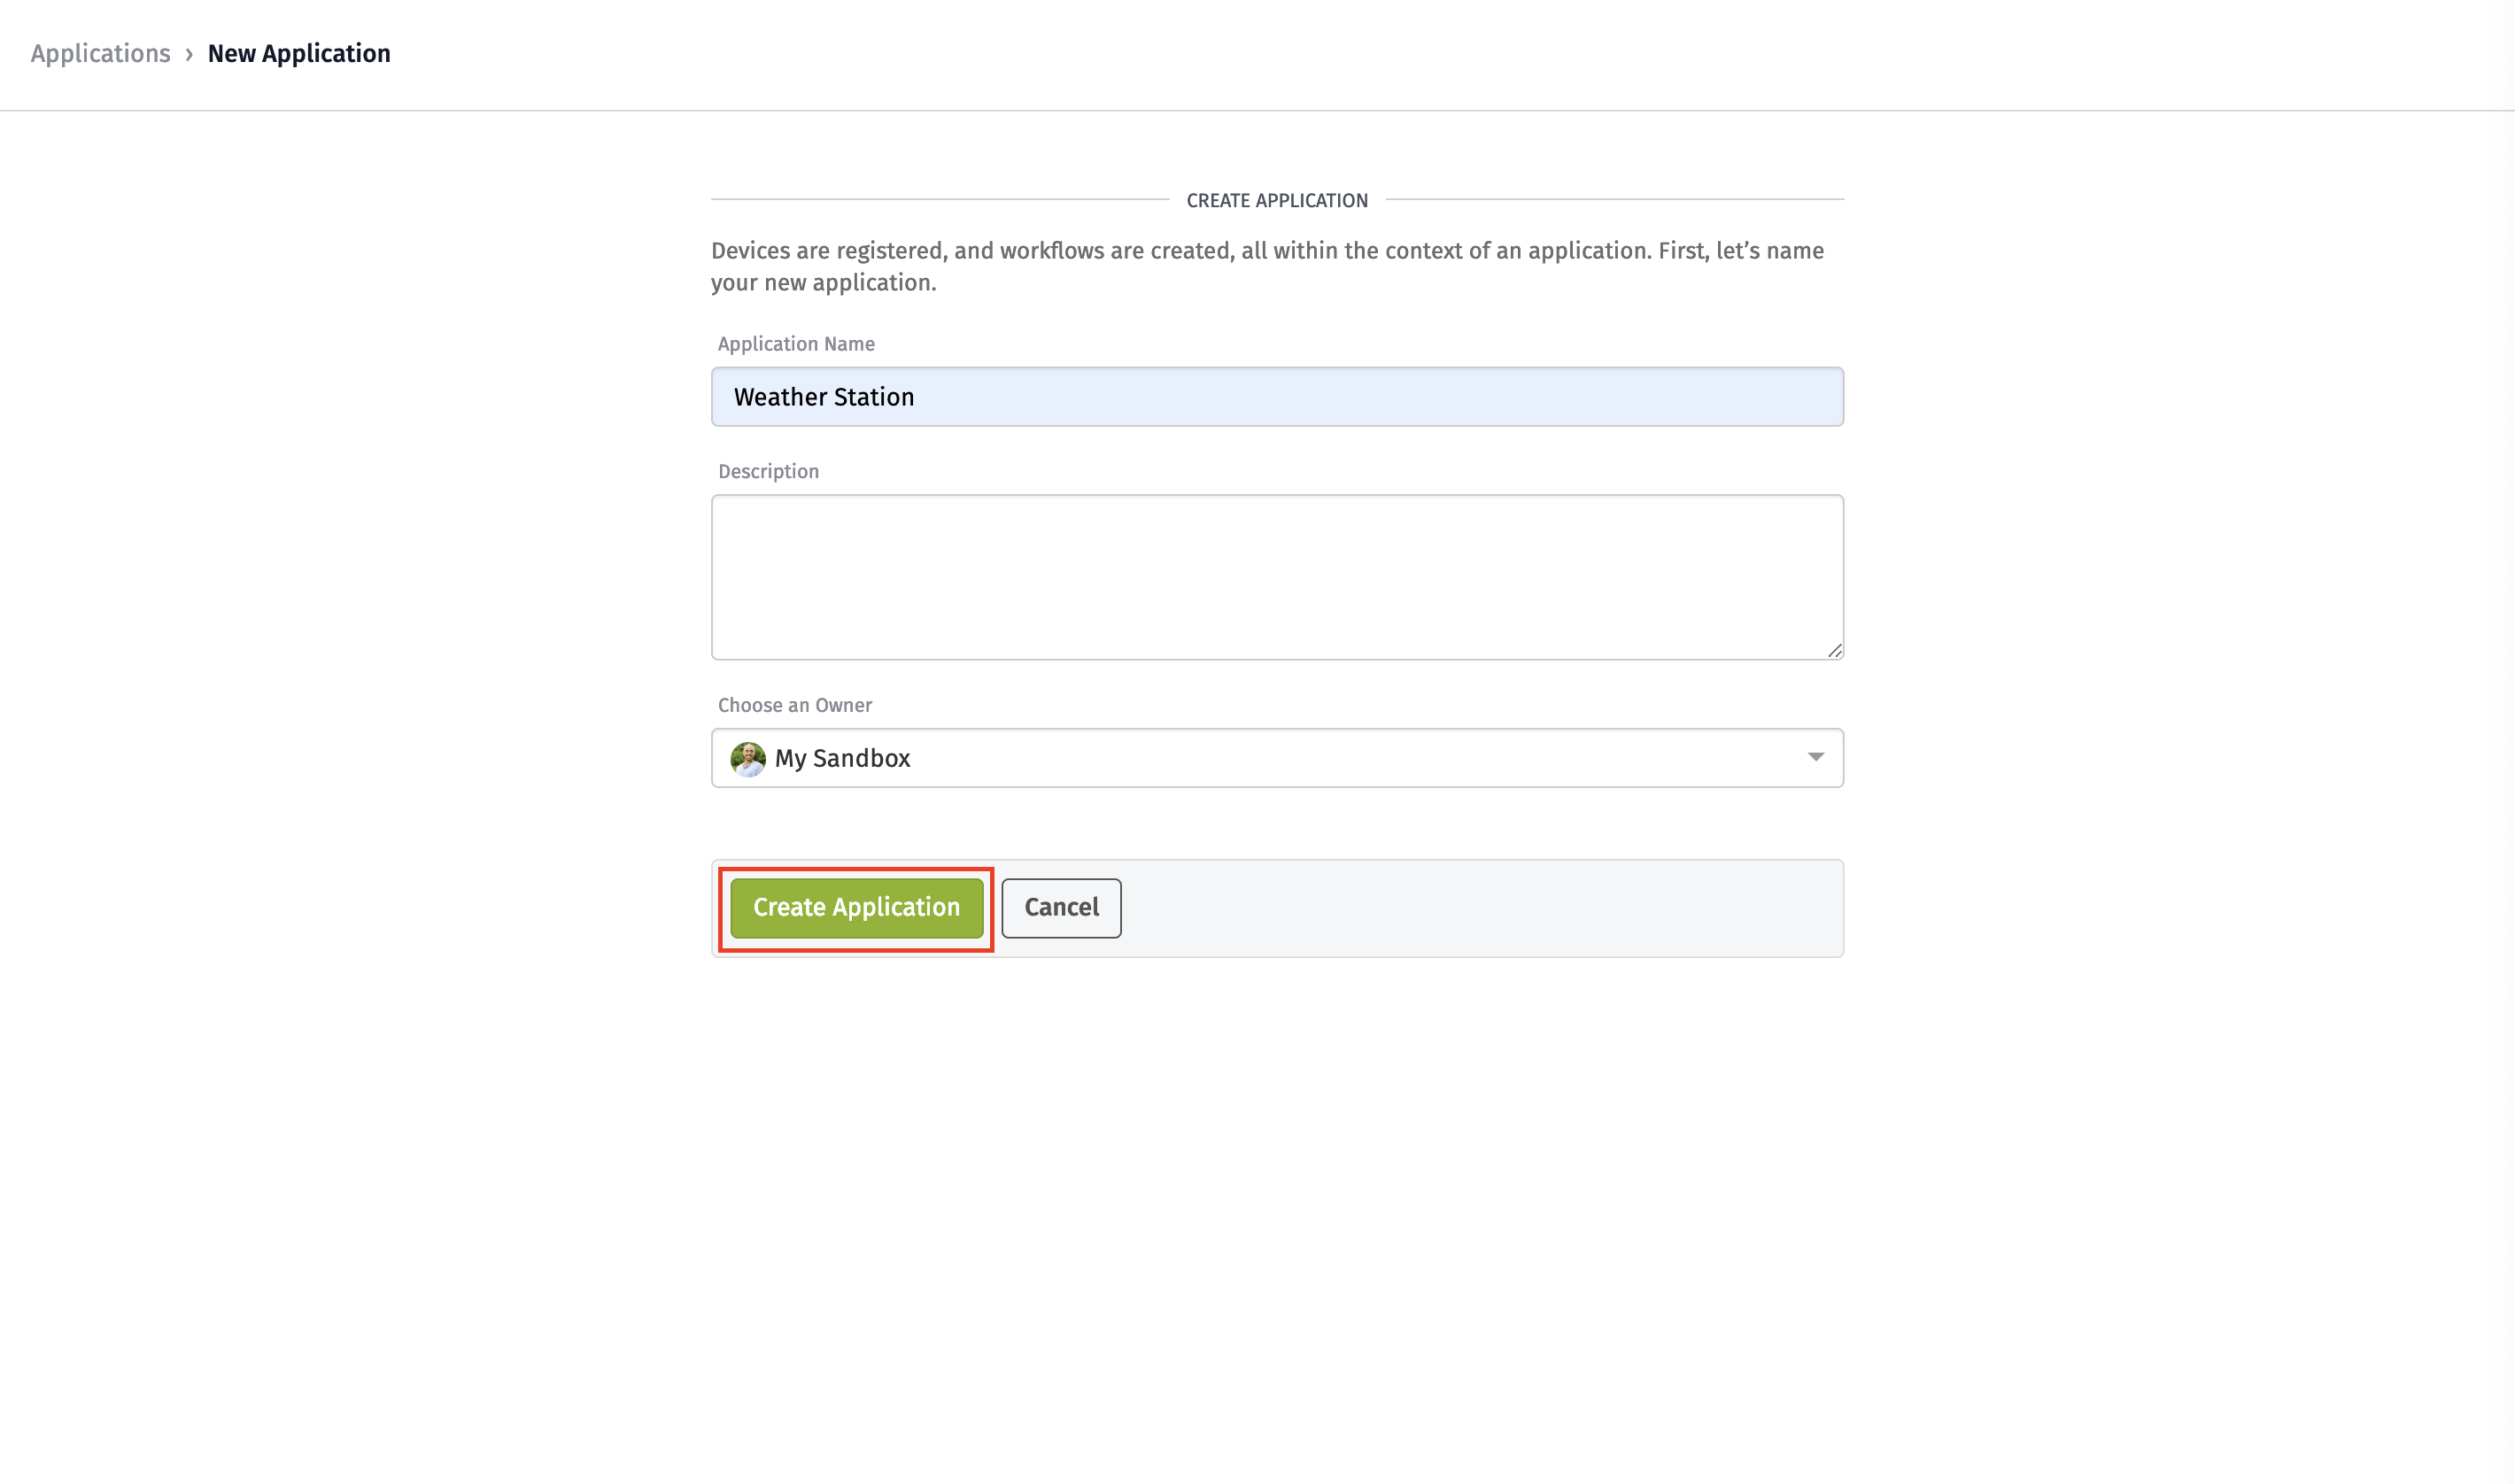
You can name and describe your application. Throughout this tutorial, we will call our application "Weather Station."
Step 3: Add the Device
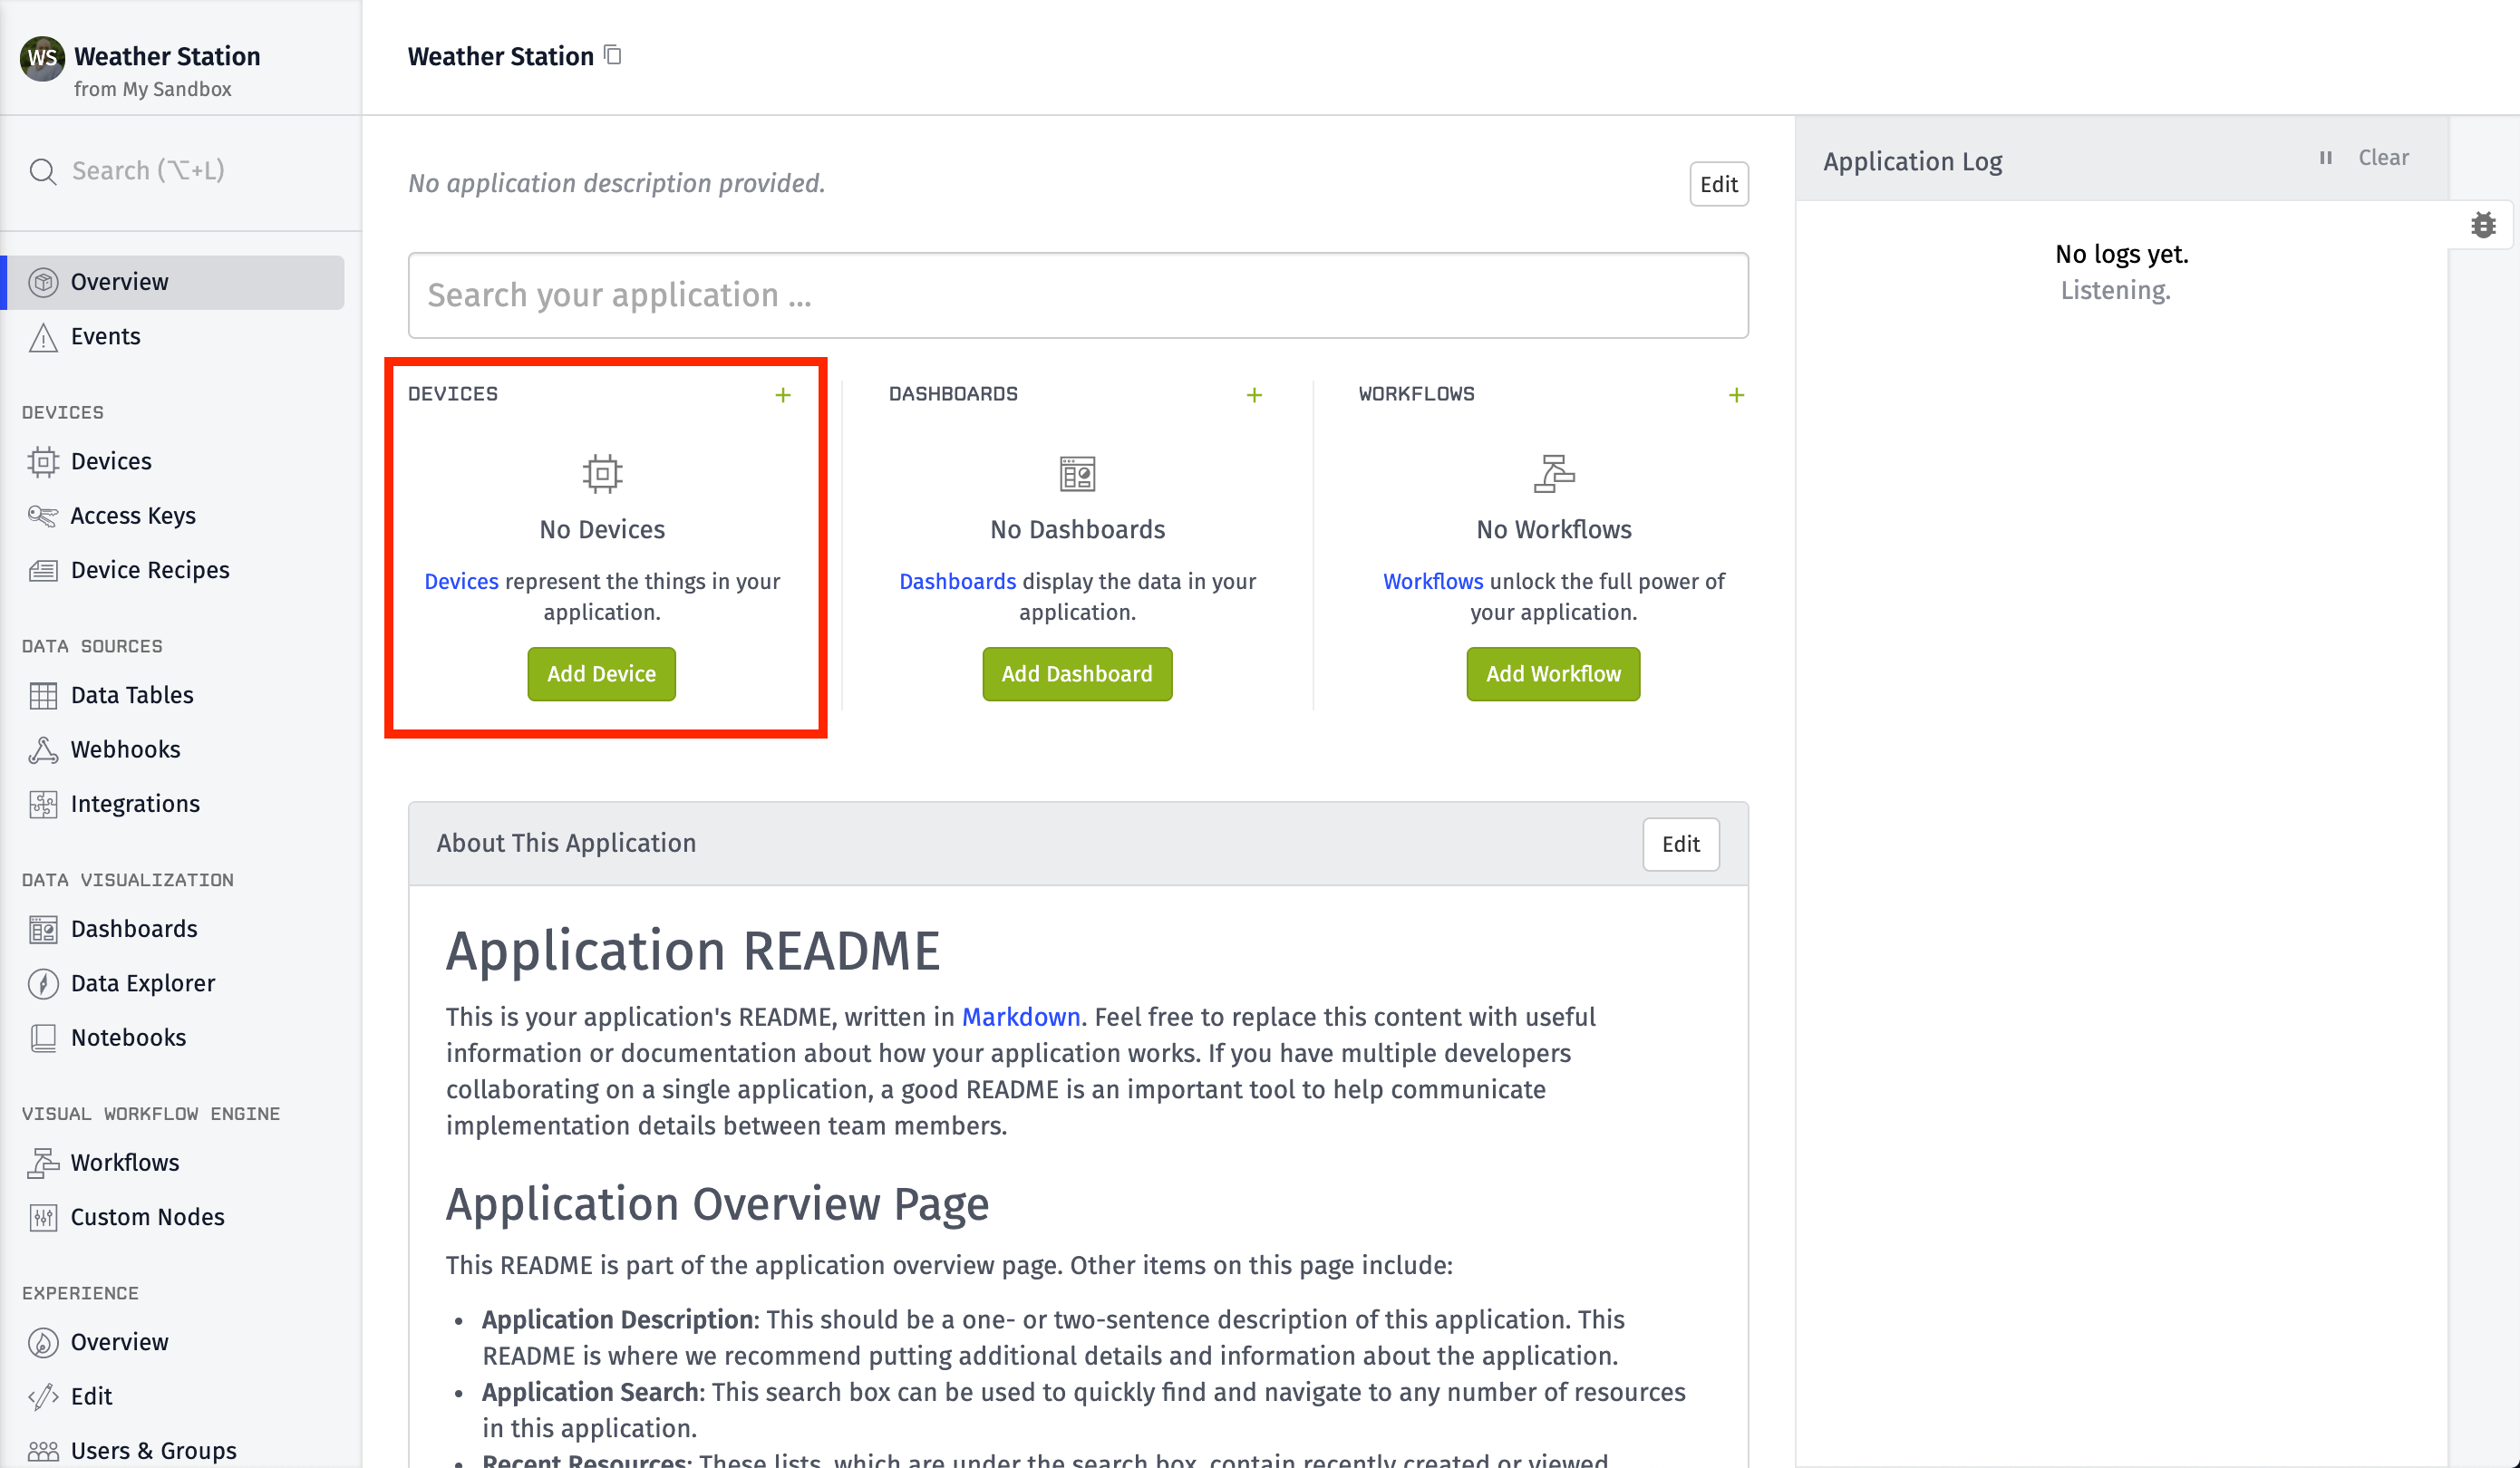
Next, to store the data from the from the OpenWeather API, we create a Device that represents the weather data (temperature, humidity, etc.).
After creating the application, you will be presented with the Application Overview page. Select "Add Device" from the Recent Devices List.
When creating the device, select "Standalone" as the Device Class.
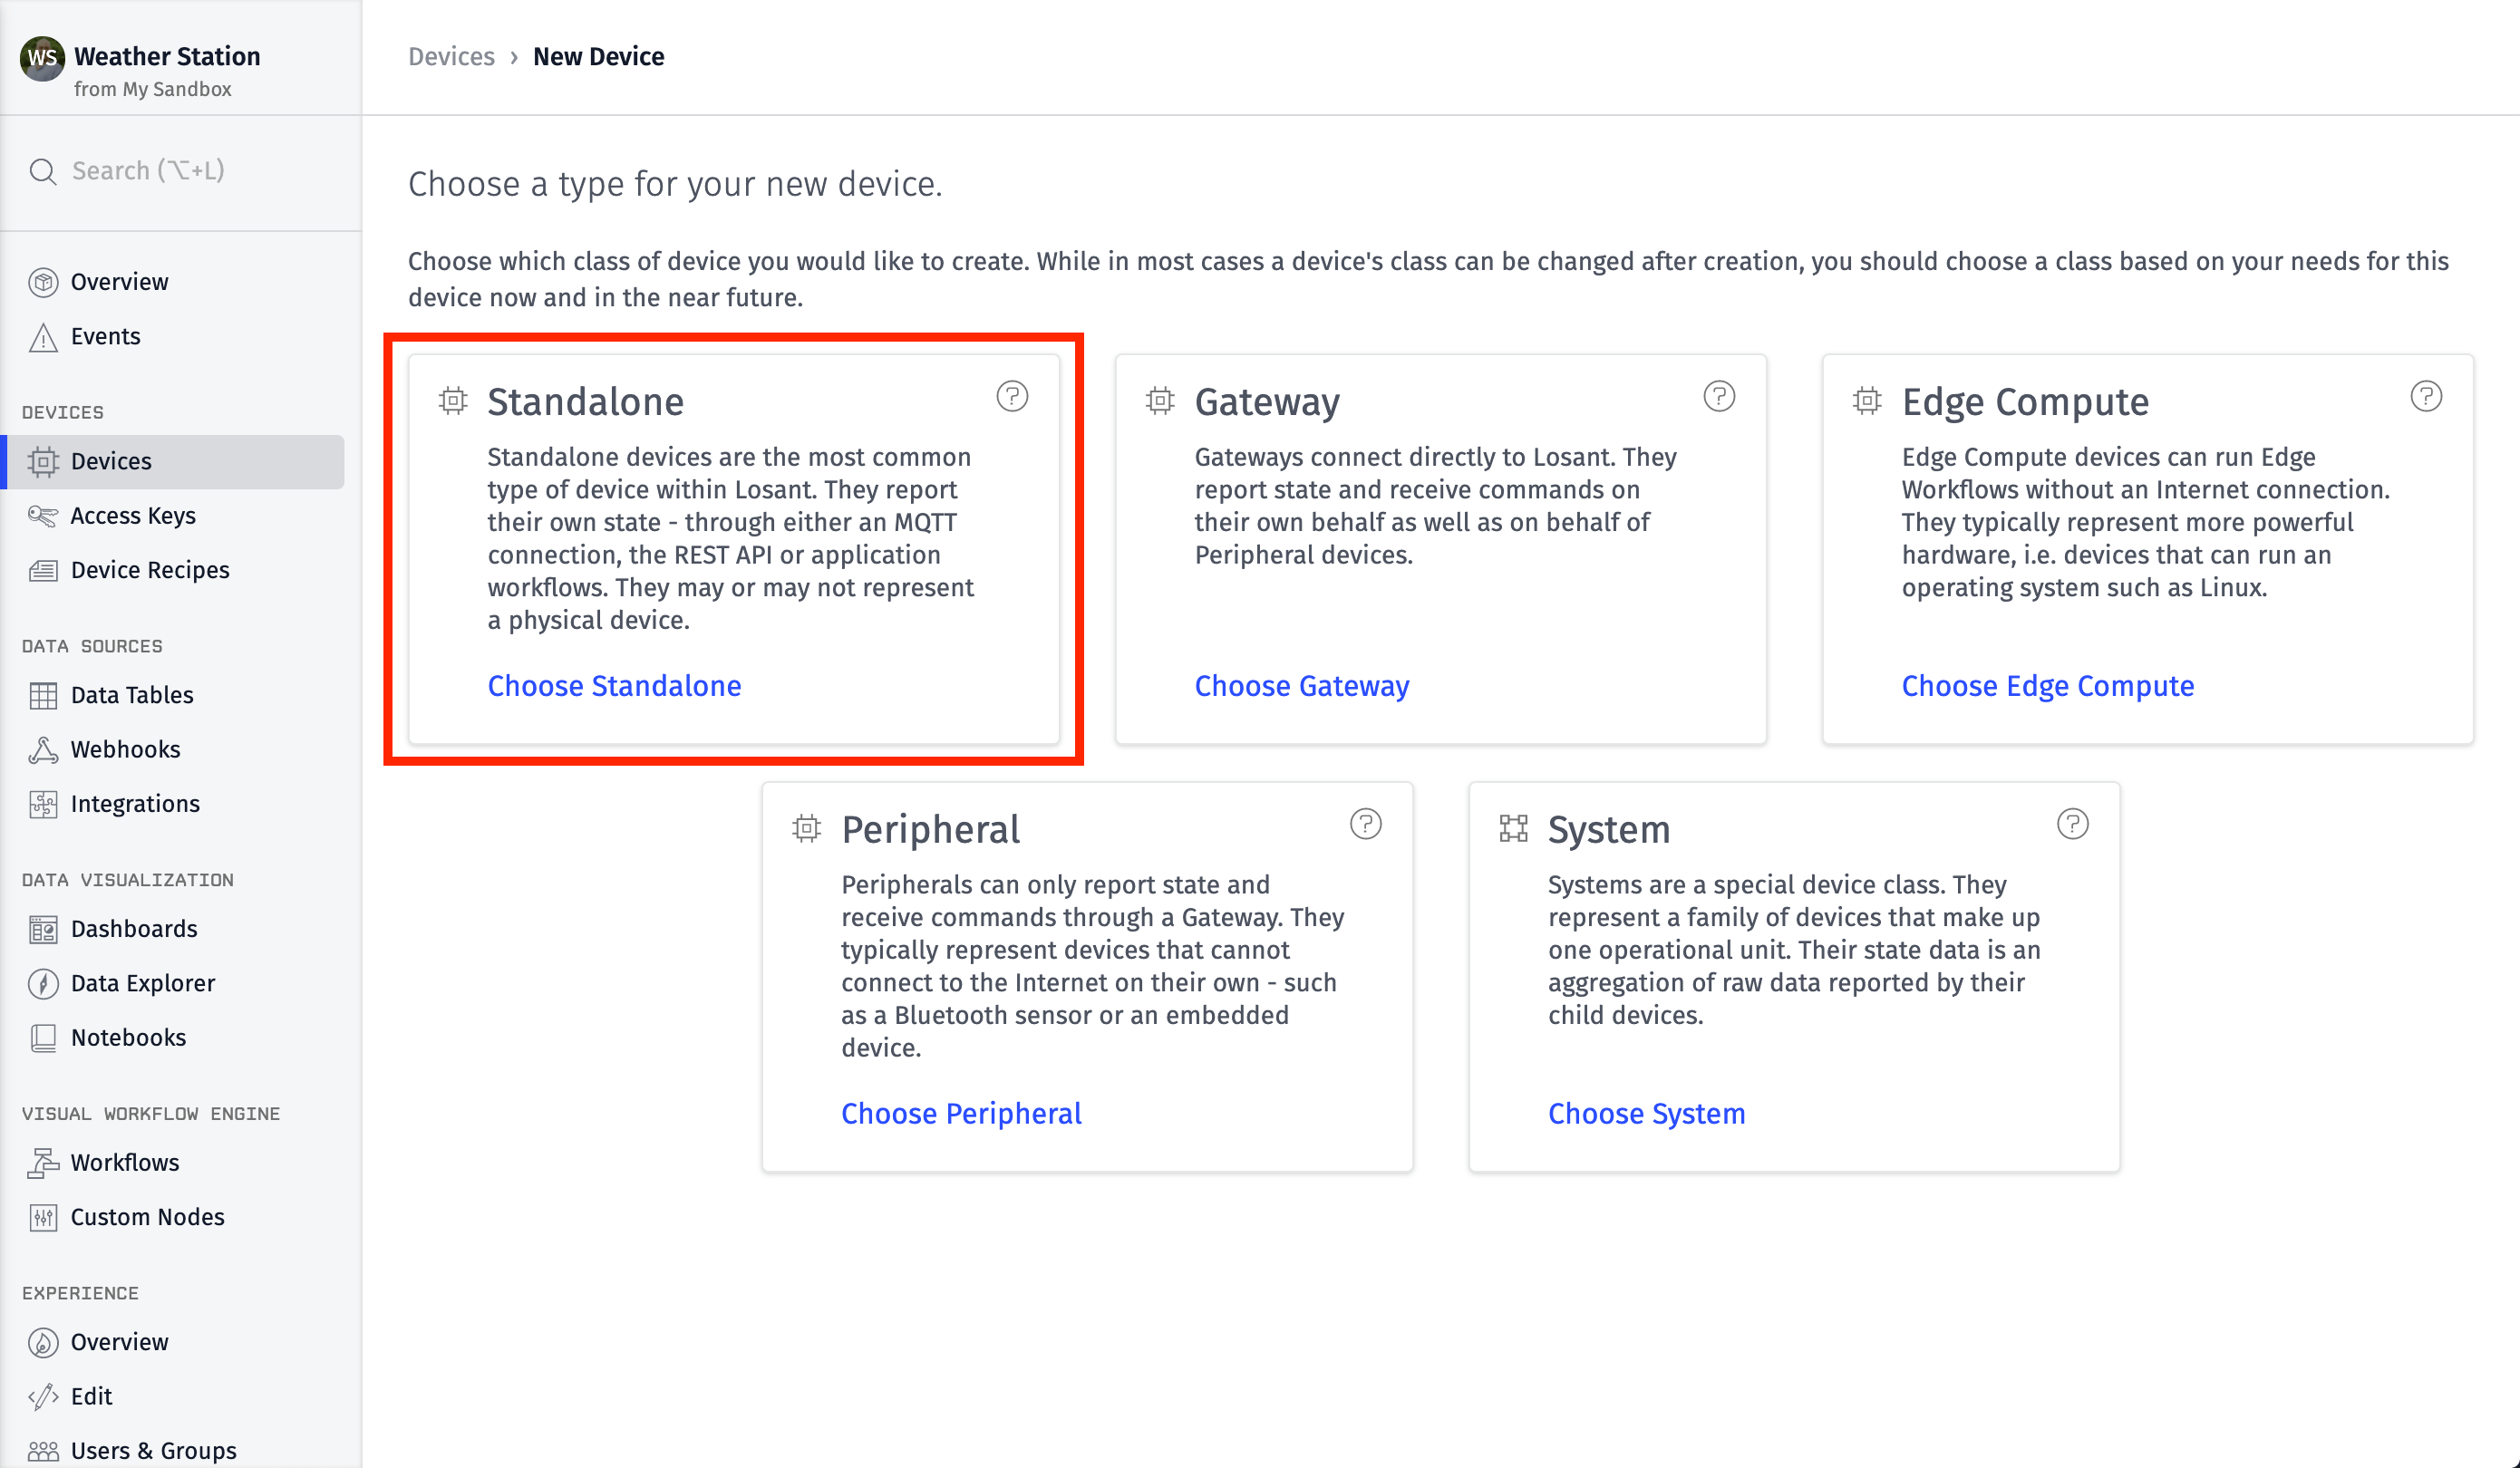
Most devices are standalone devices. Our device is a standalone device because the data source of this device is an API.
Configure Device
Next, configure your new device. Provide a name and an optional description for your device. For this walkthrough, we will not be configuring a Parent System or Device Tag, so you can leave these blank.
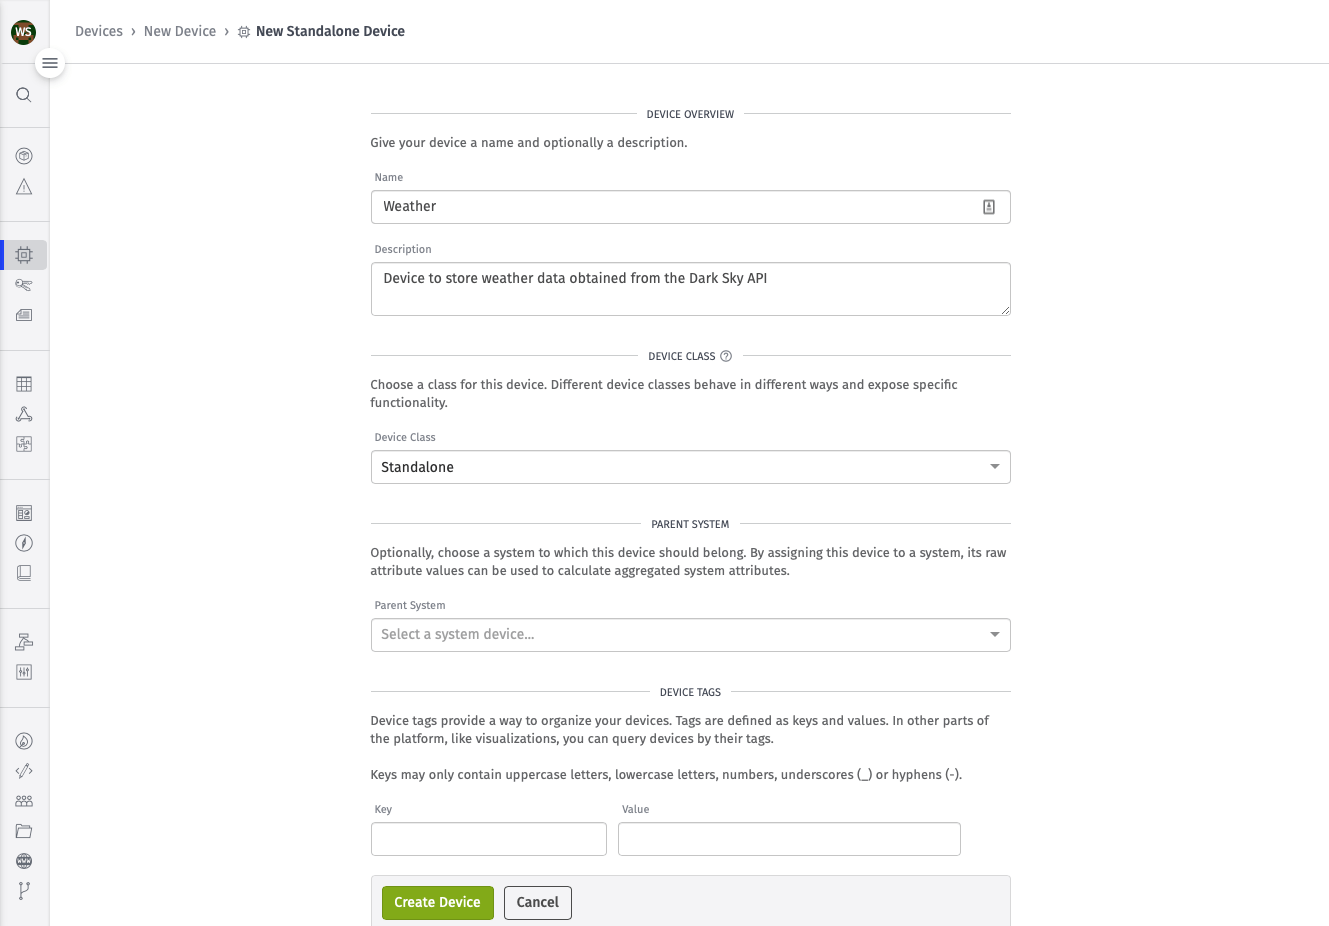
Select "Create Device" to configure the attributes for your new device.
Need any help? You can always ask for help in the WEGnology Forums.
Device Attributes
The OpenWeather API provides a lot of information, but we only need to track and store the most common information:
feels-like- Apparent temperature with wind chill and humidity accounted for.humidity- Relative humidity in percent.pressure- Sea-level air pressure in millibars.temp- Temperature in degrees Kelvin.visibility- Average visibility in miles.wind-speed- Wind speed in miles per hour.
You've already made the device within WEGnology that represents the OpenWeather API. Now, we can create our attributes.
Device Attributes describe each data point your device is collecting. Attributes are used by WEGnology to identify the data this device will report and store in WEGnology's time-series database.
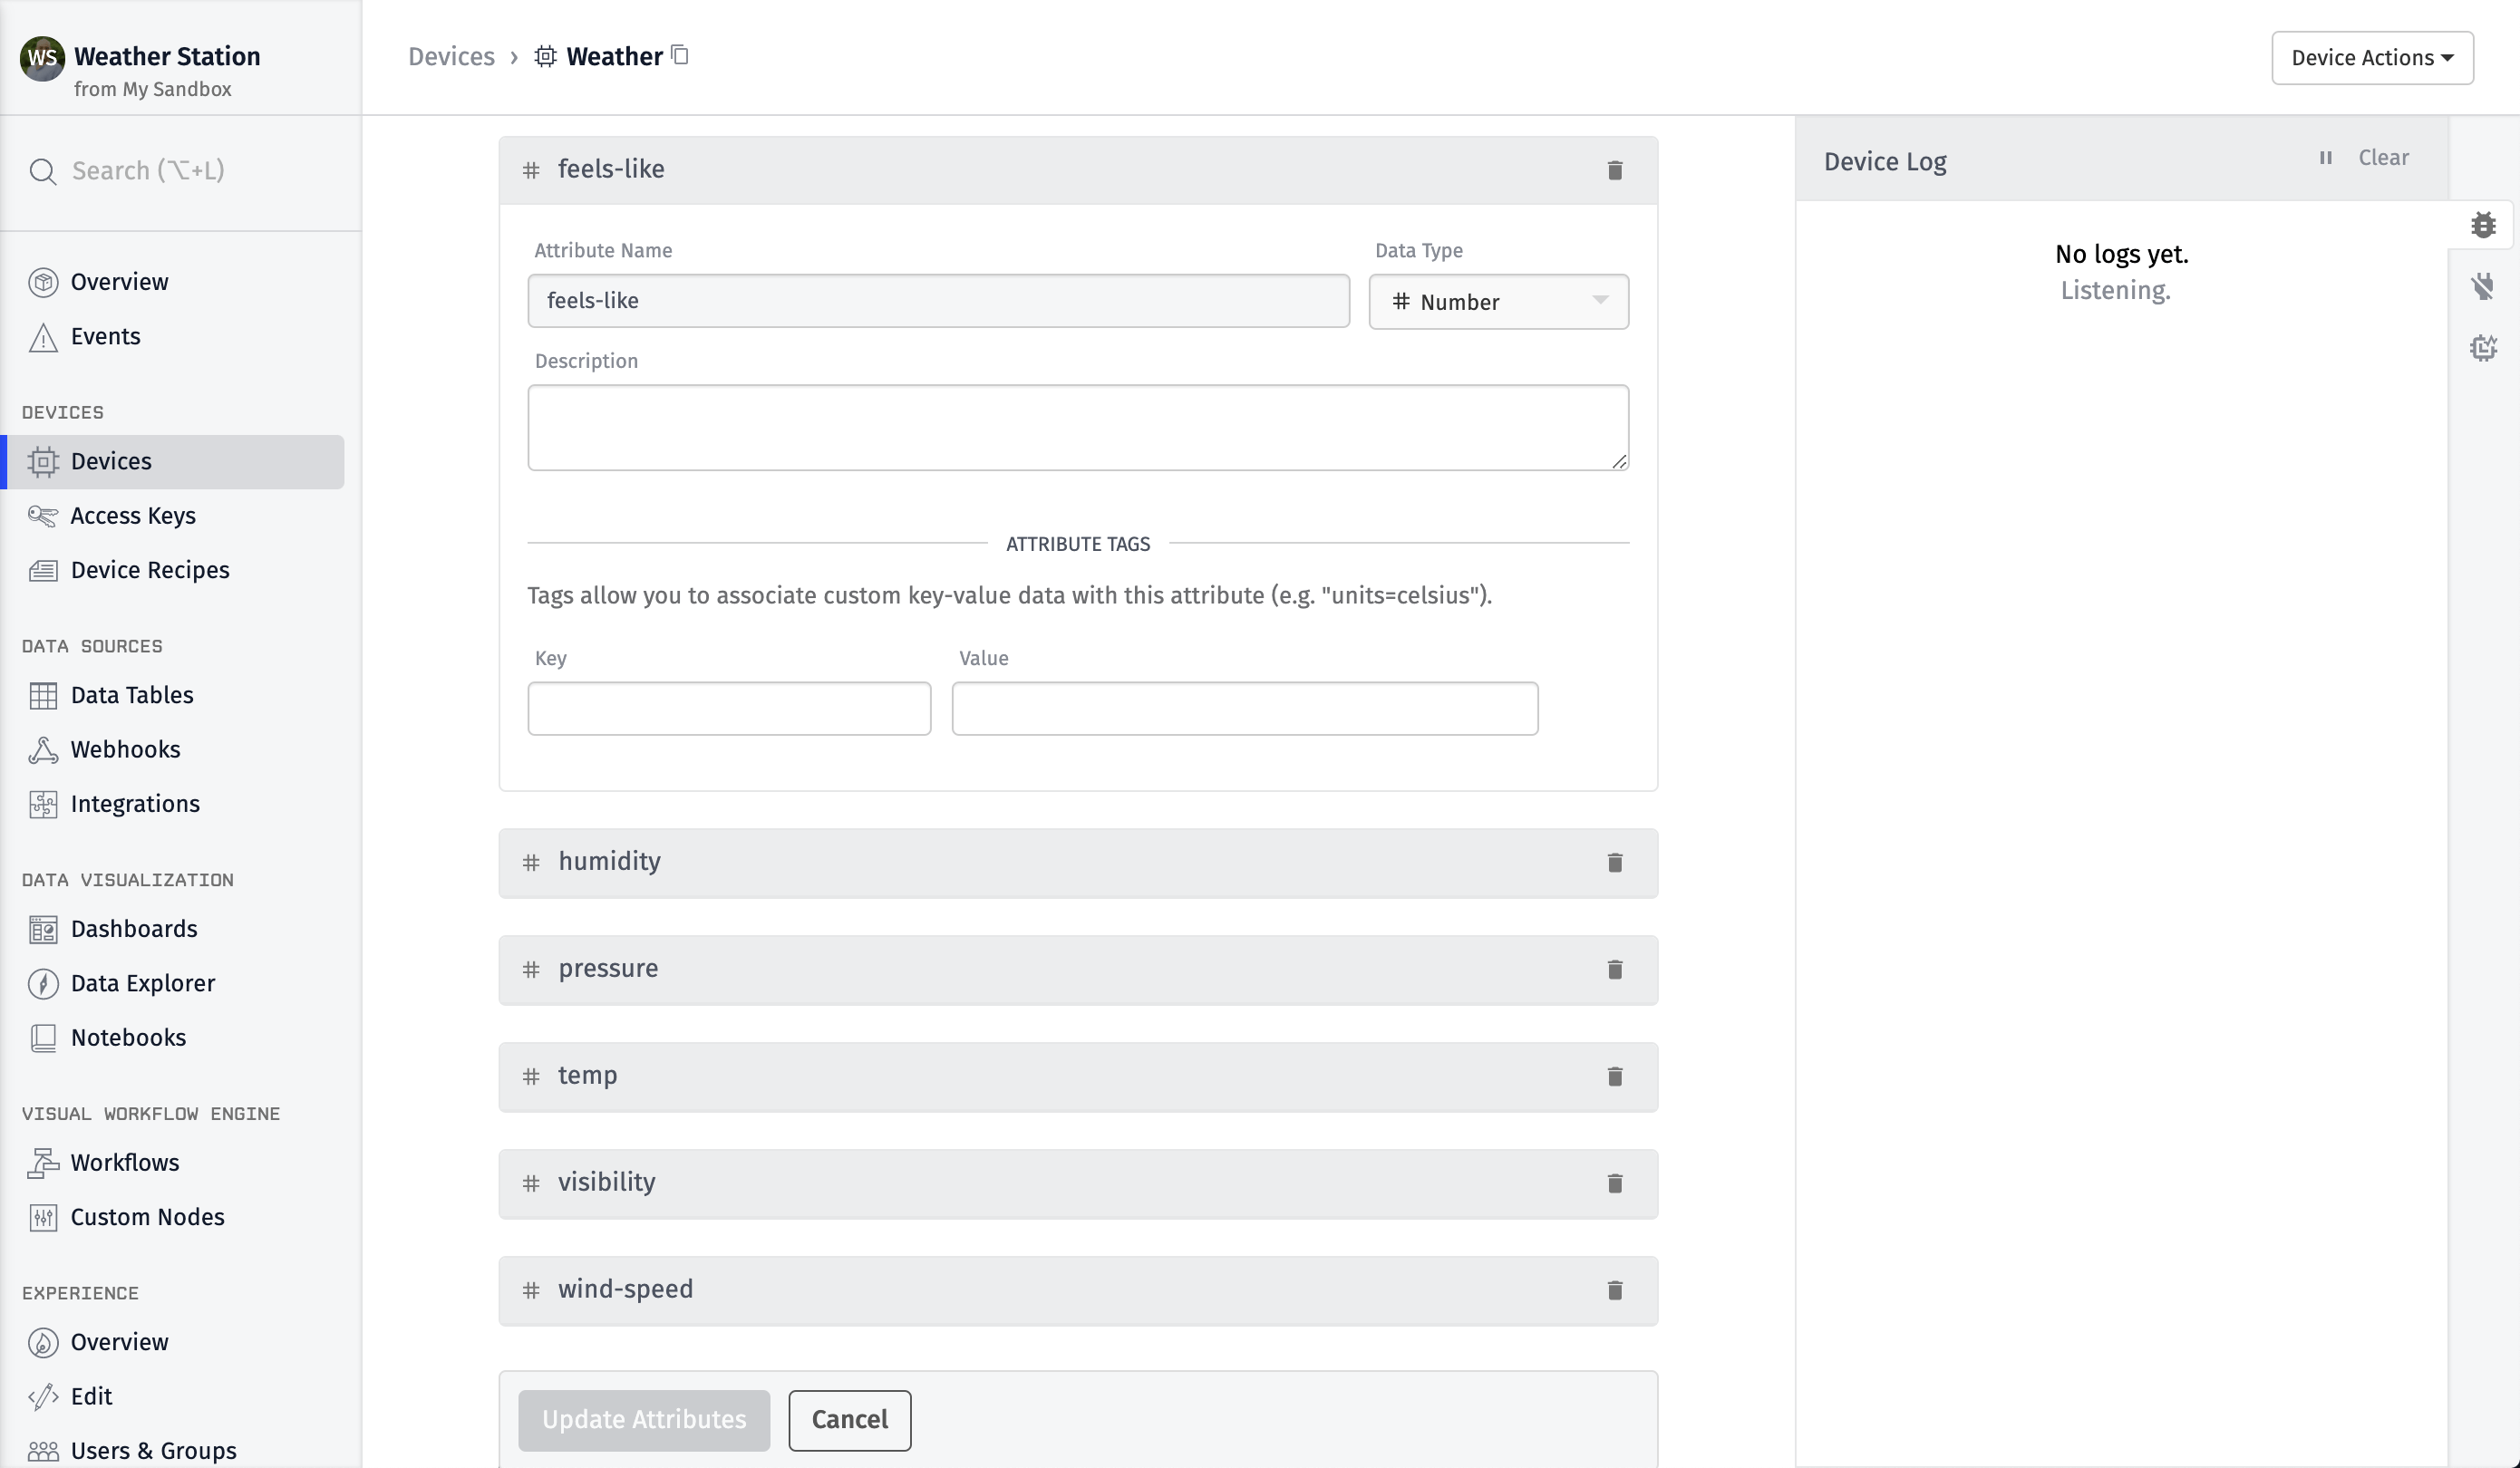
After you've configured the attributes defined above, click the "Update Attributes" button.
Now that we have a device set up to track and store the data within WEGnology, let's create a workflow to pull the data from the OpenWeather API and store it to our device.
Step 4: Requesting Weather Data
Workflows allow you to describe the logic for your application. For our Weather Station, we need to periodically request weather data. So, the logic would be:
Every two minutes, request weather data from the OpenWeather API and store it on our new device.
To create a workflow, select "Workflows" from the Application Menu. Then, select "Add Workflow."
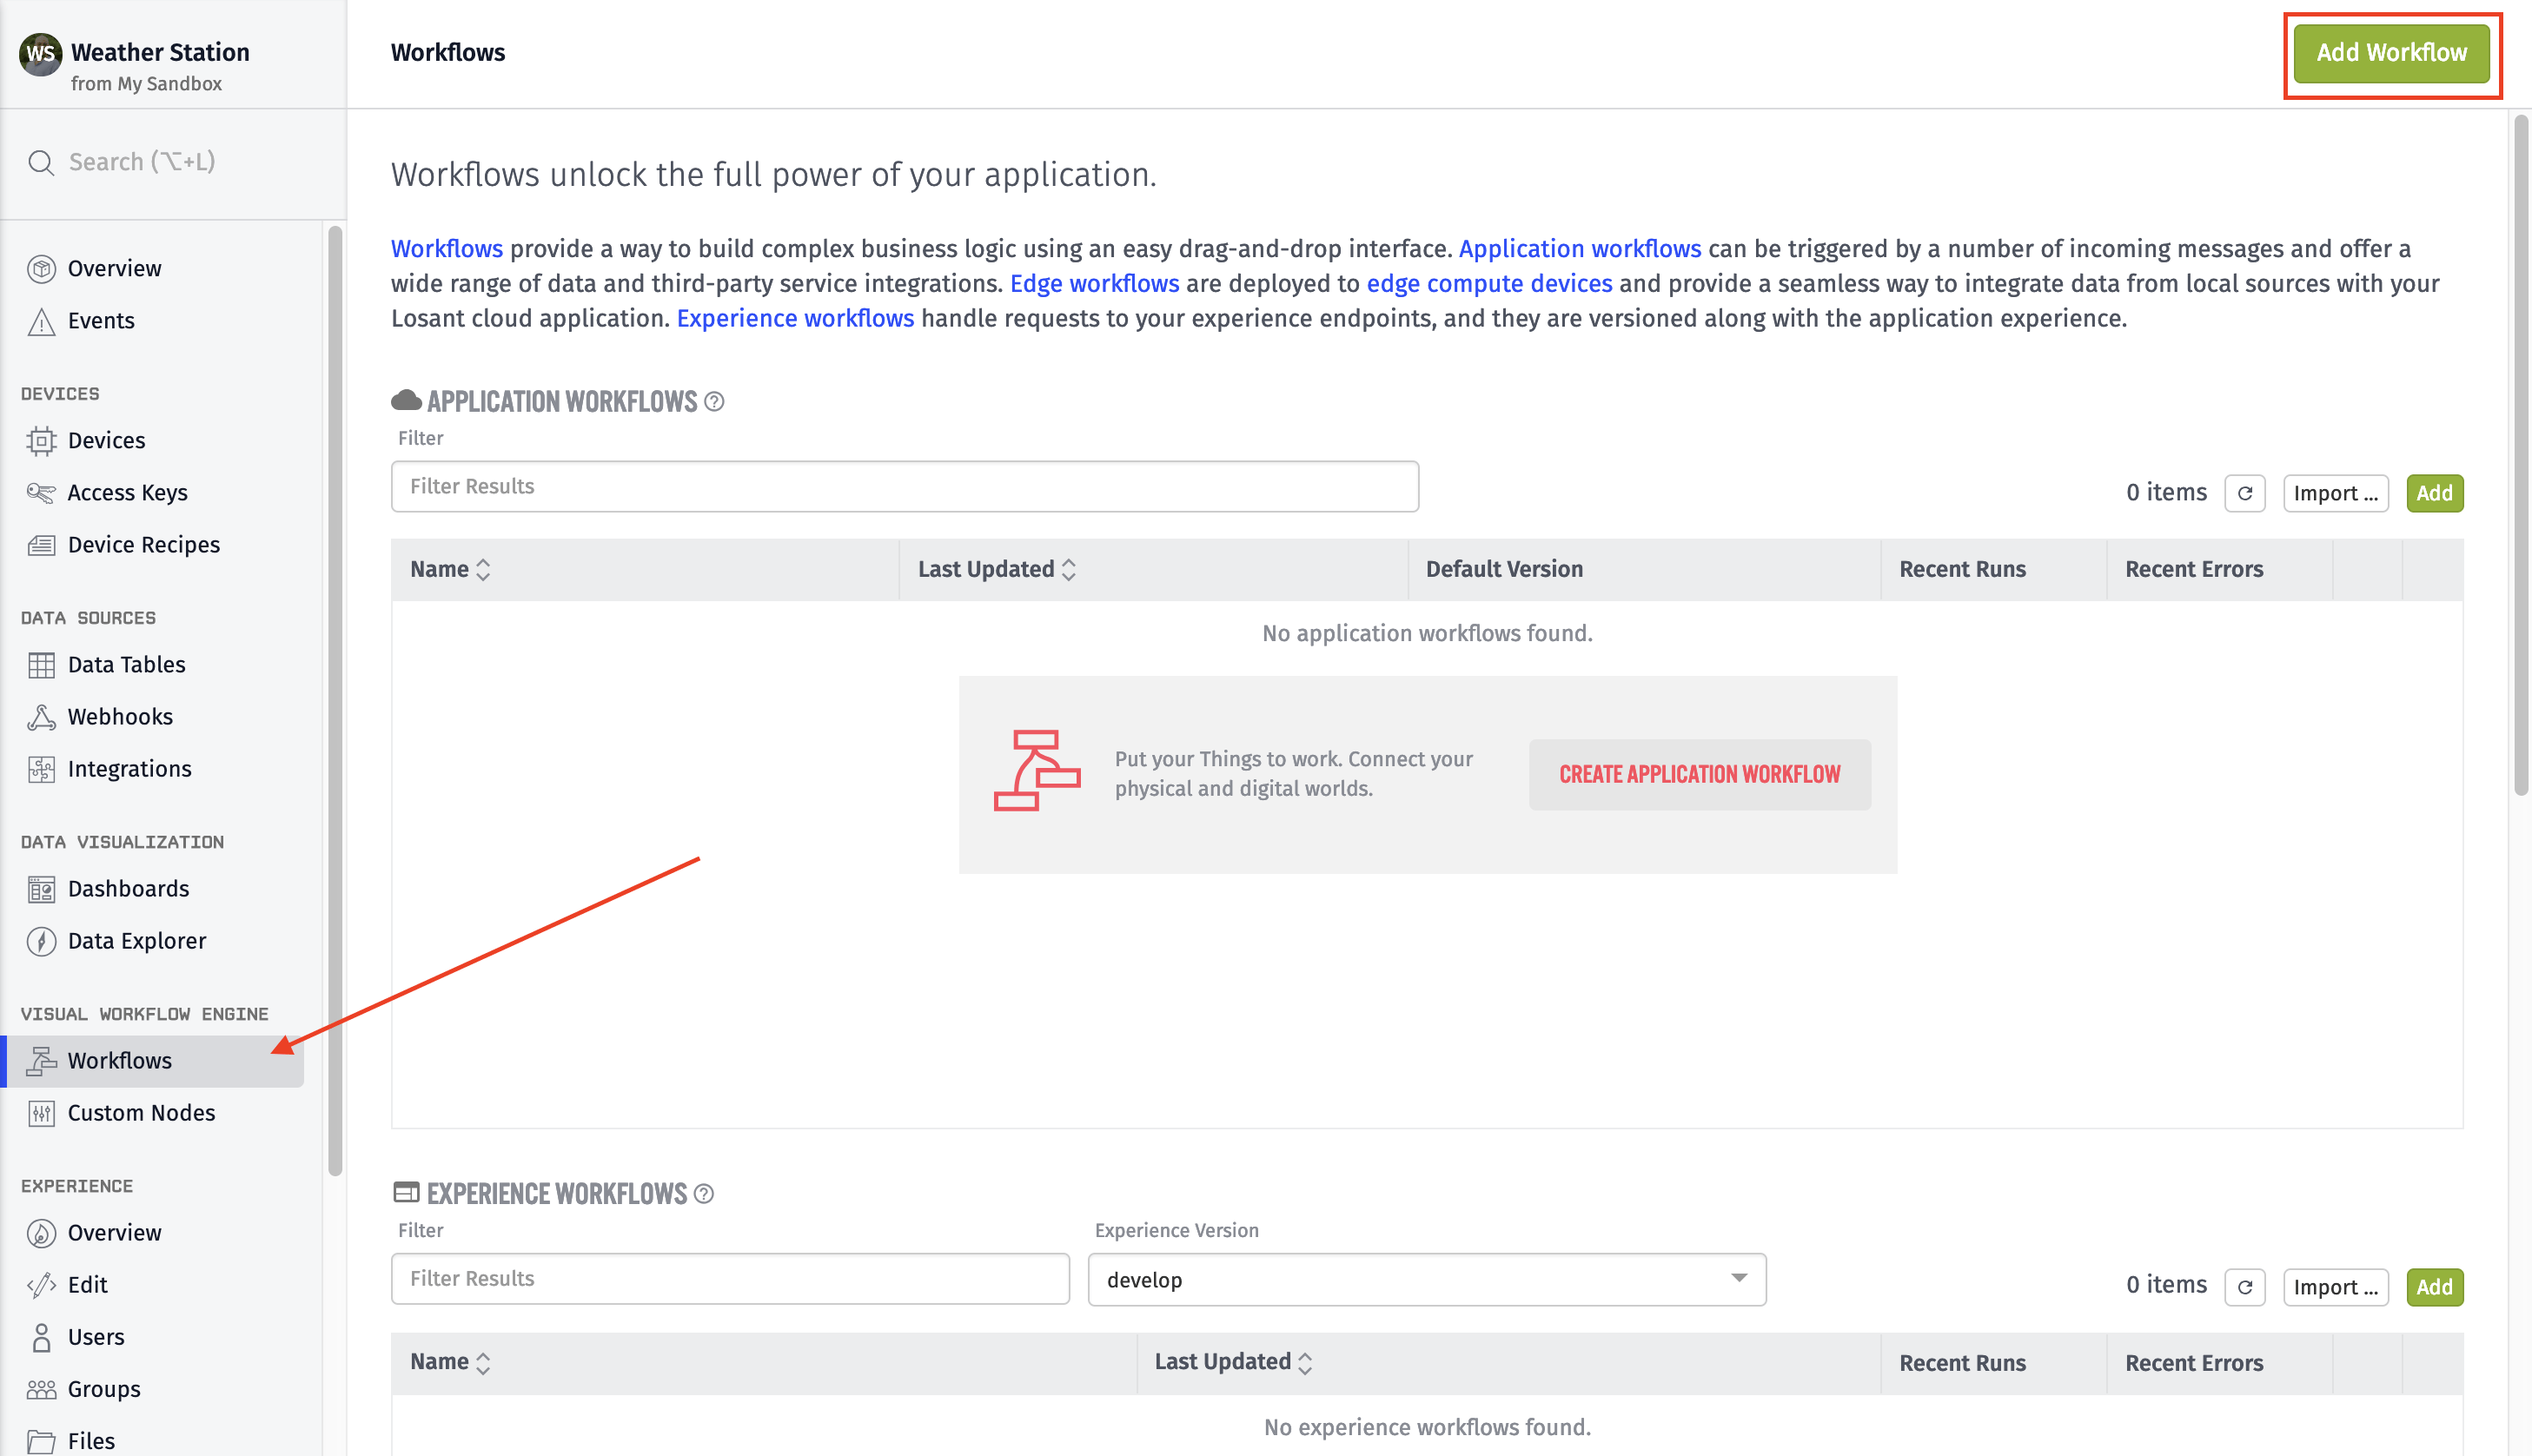
Give your workflow a name, select Application Workflow as the workflow type and give your workflow a brief description.
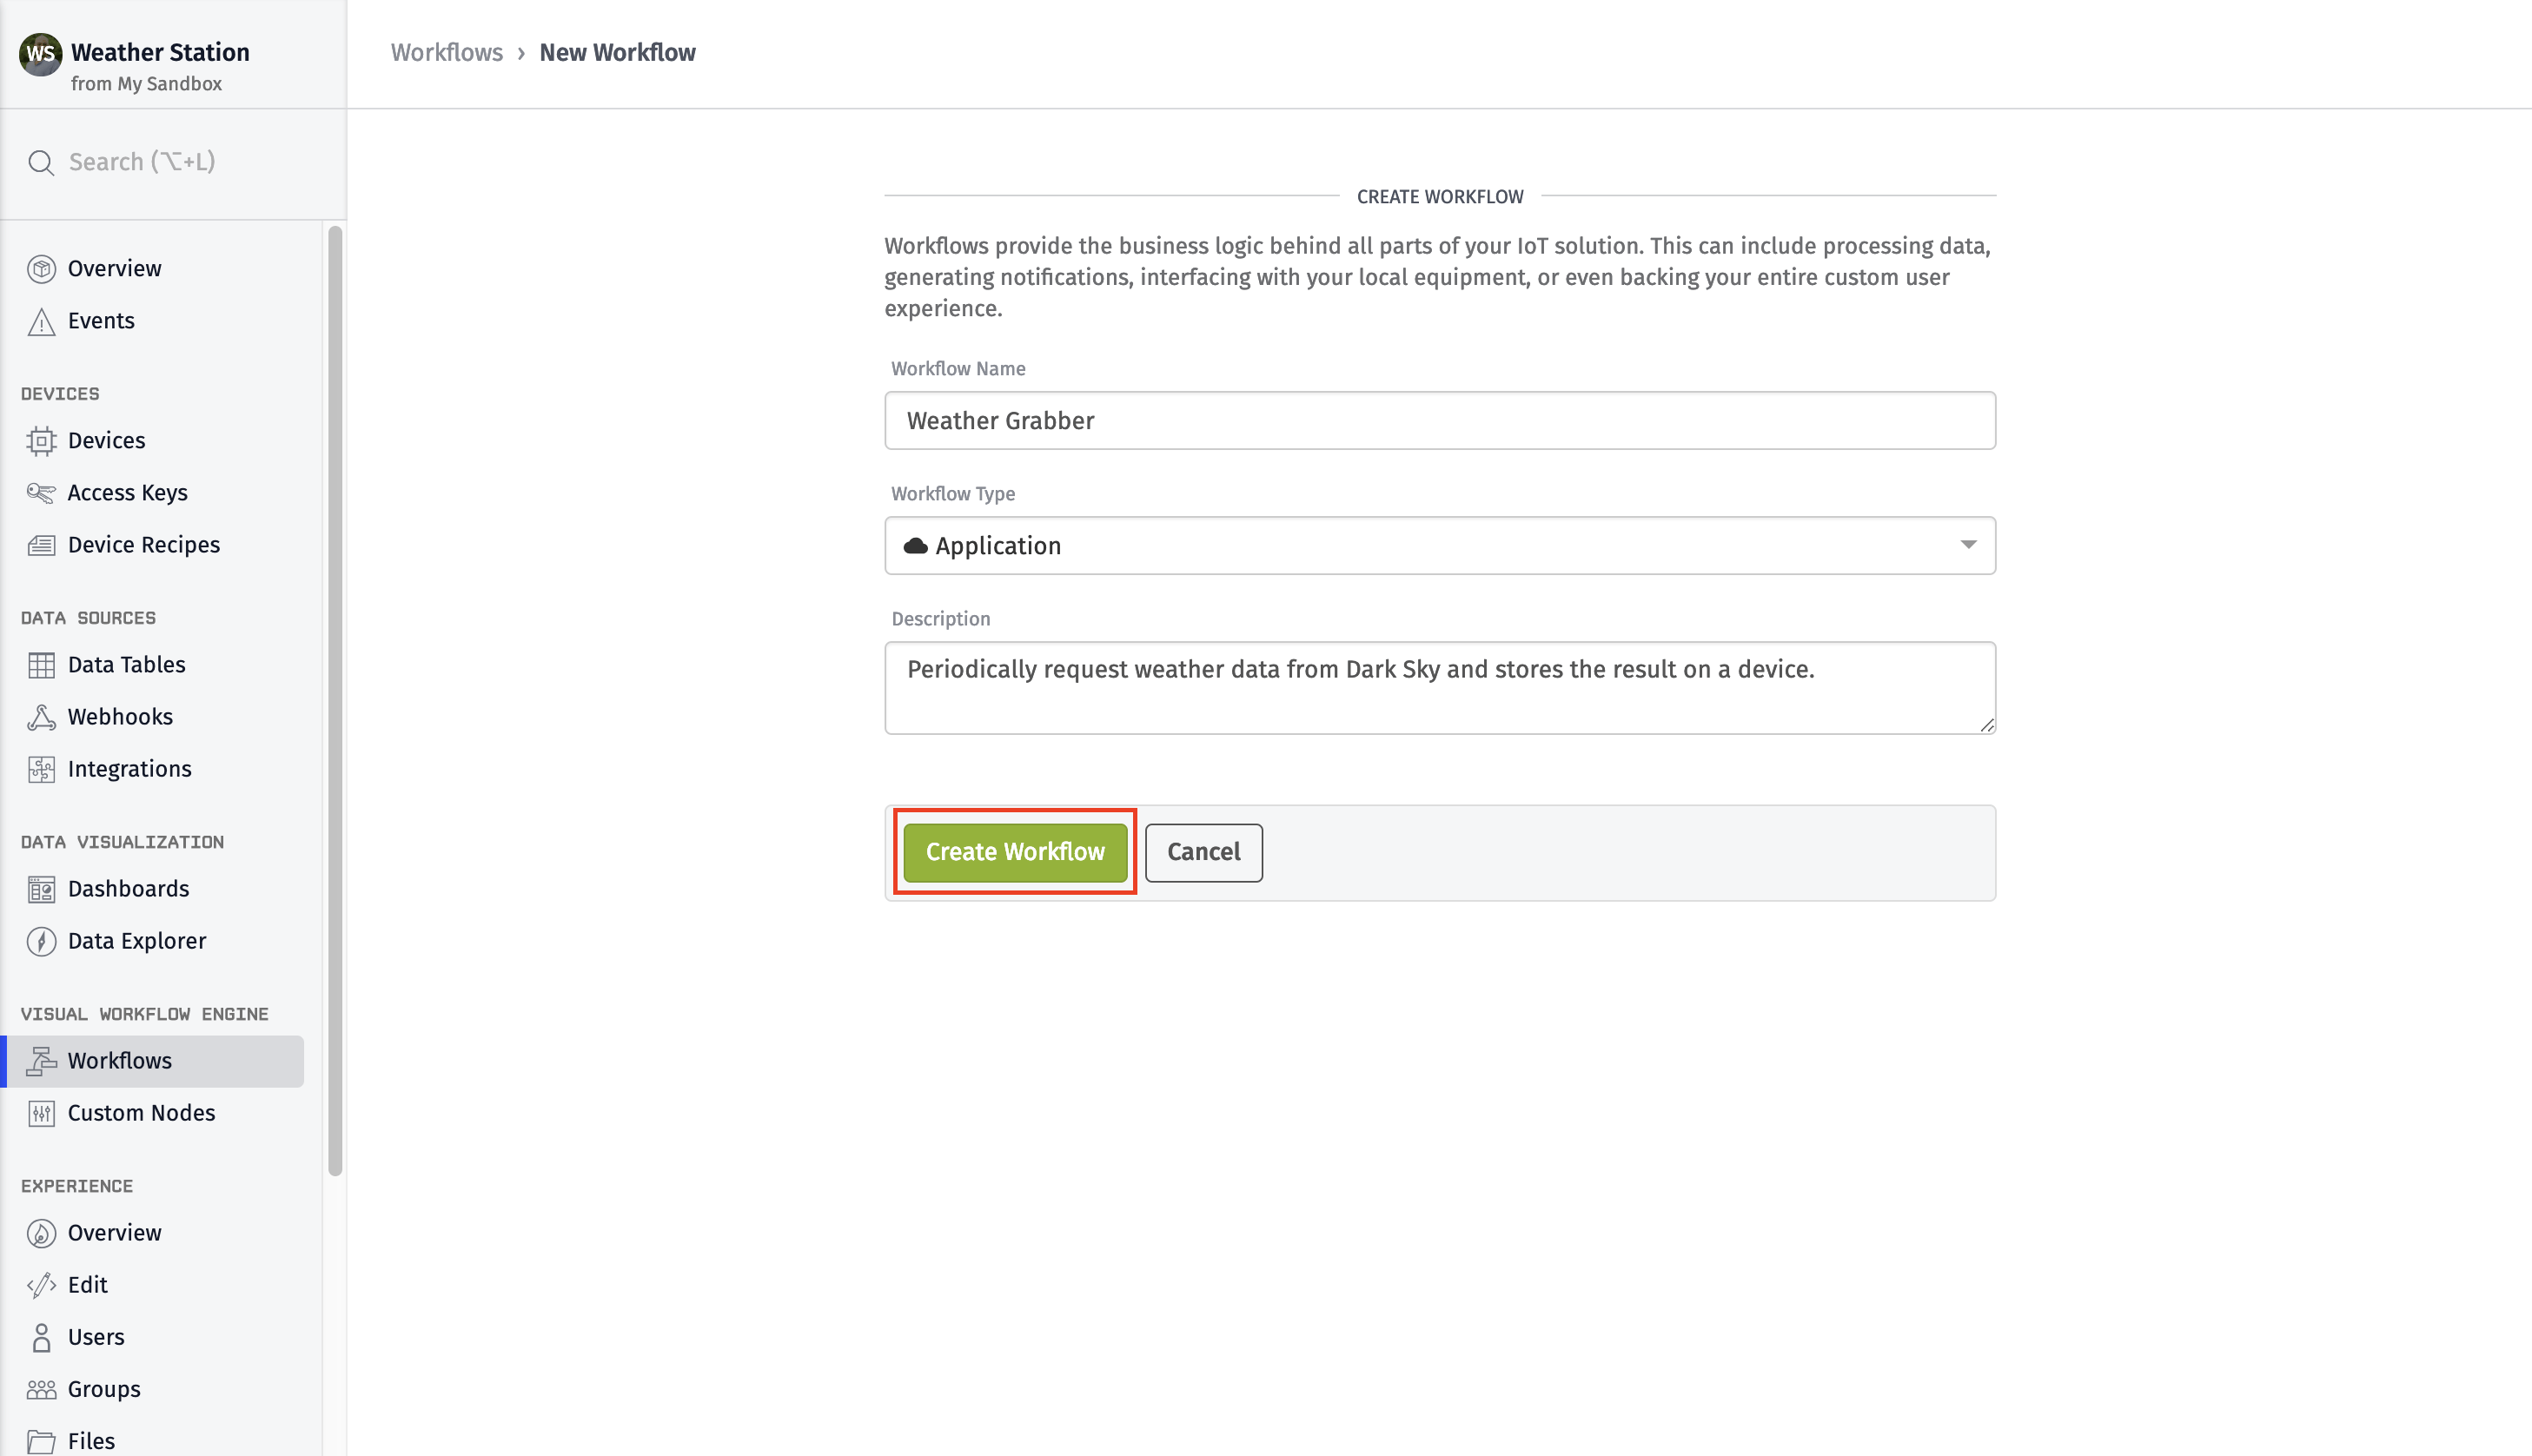
Select "Create Workflow".
Application Workflows run in WEGnology's cloud. They can trigger logic when a device sends data to WEGnology. In this case, we can use an application workflow to query data from another service and store it within WEGnology.
After creation, you will be taken to the workflow canvas.
Timer Trigger
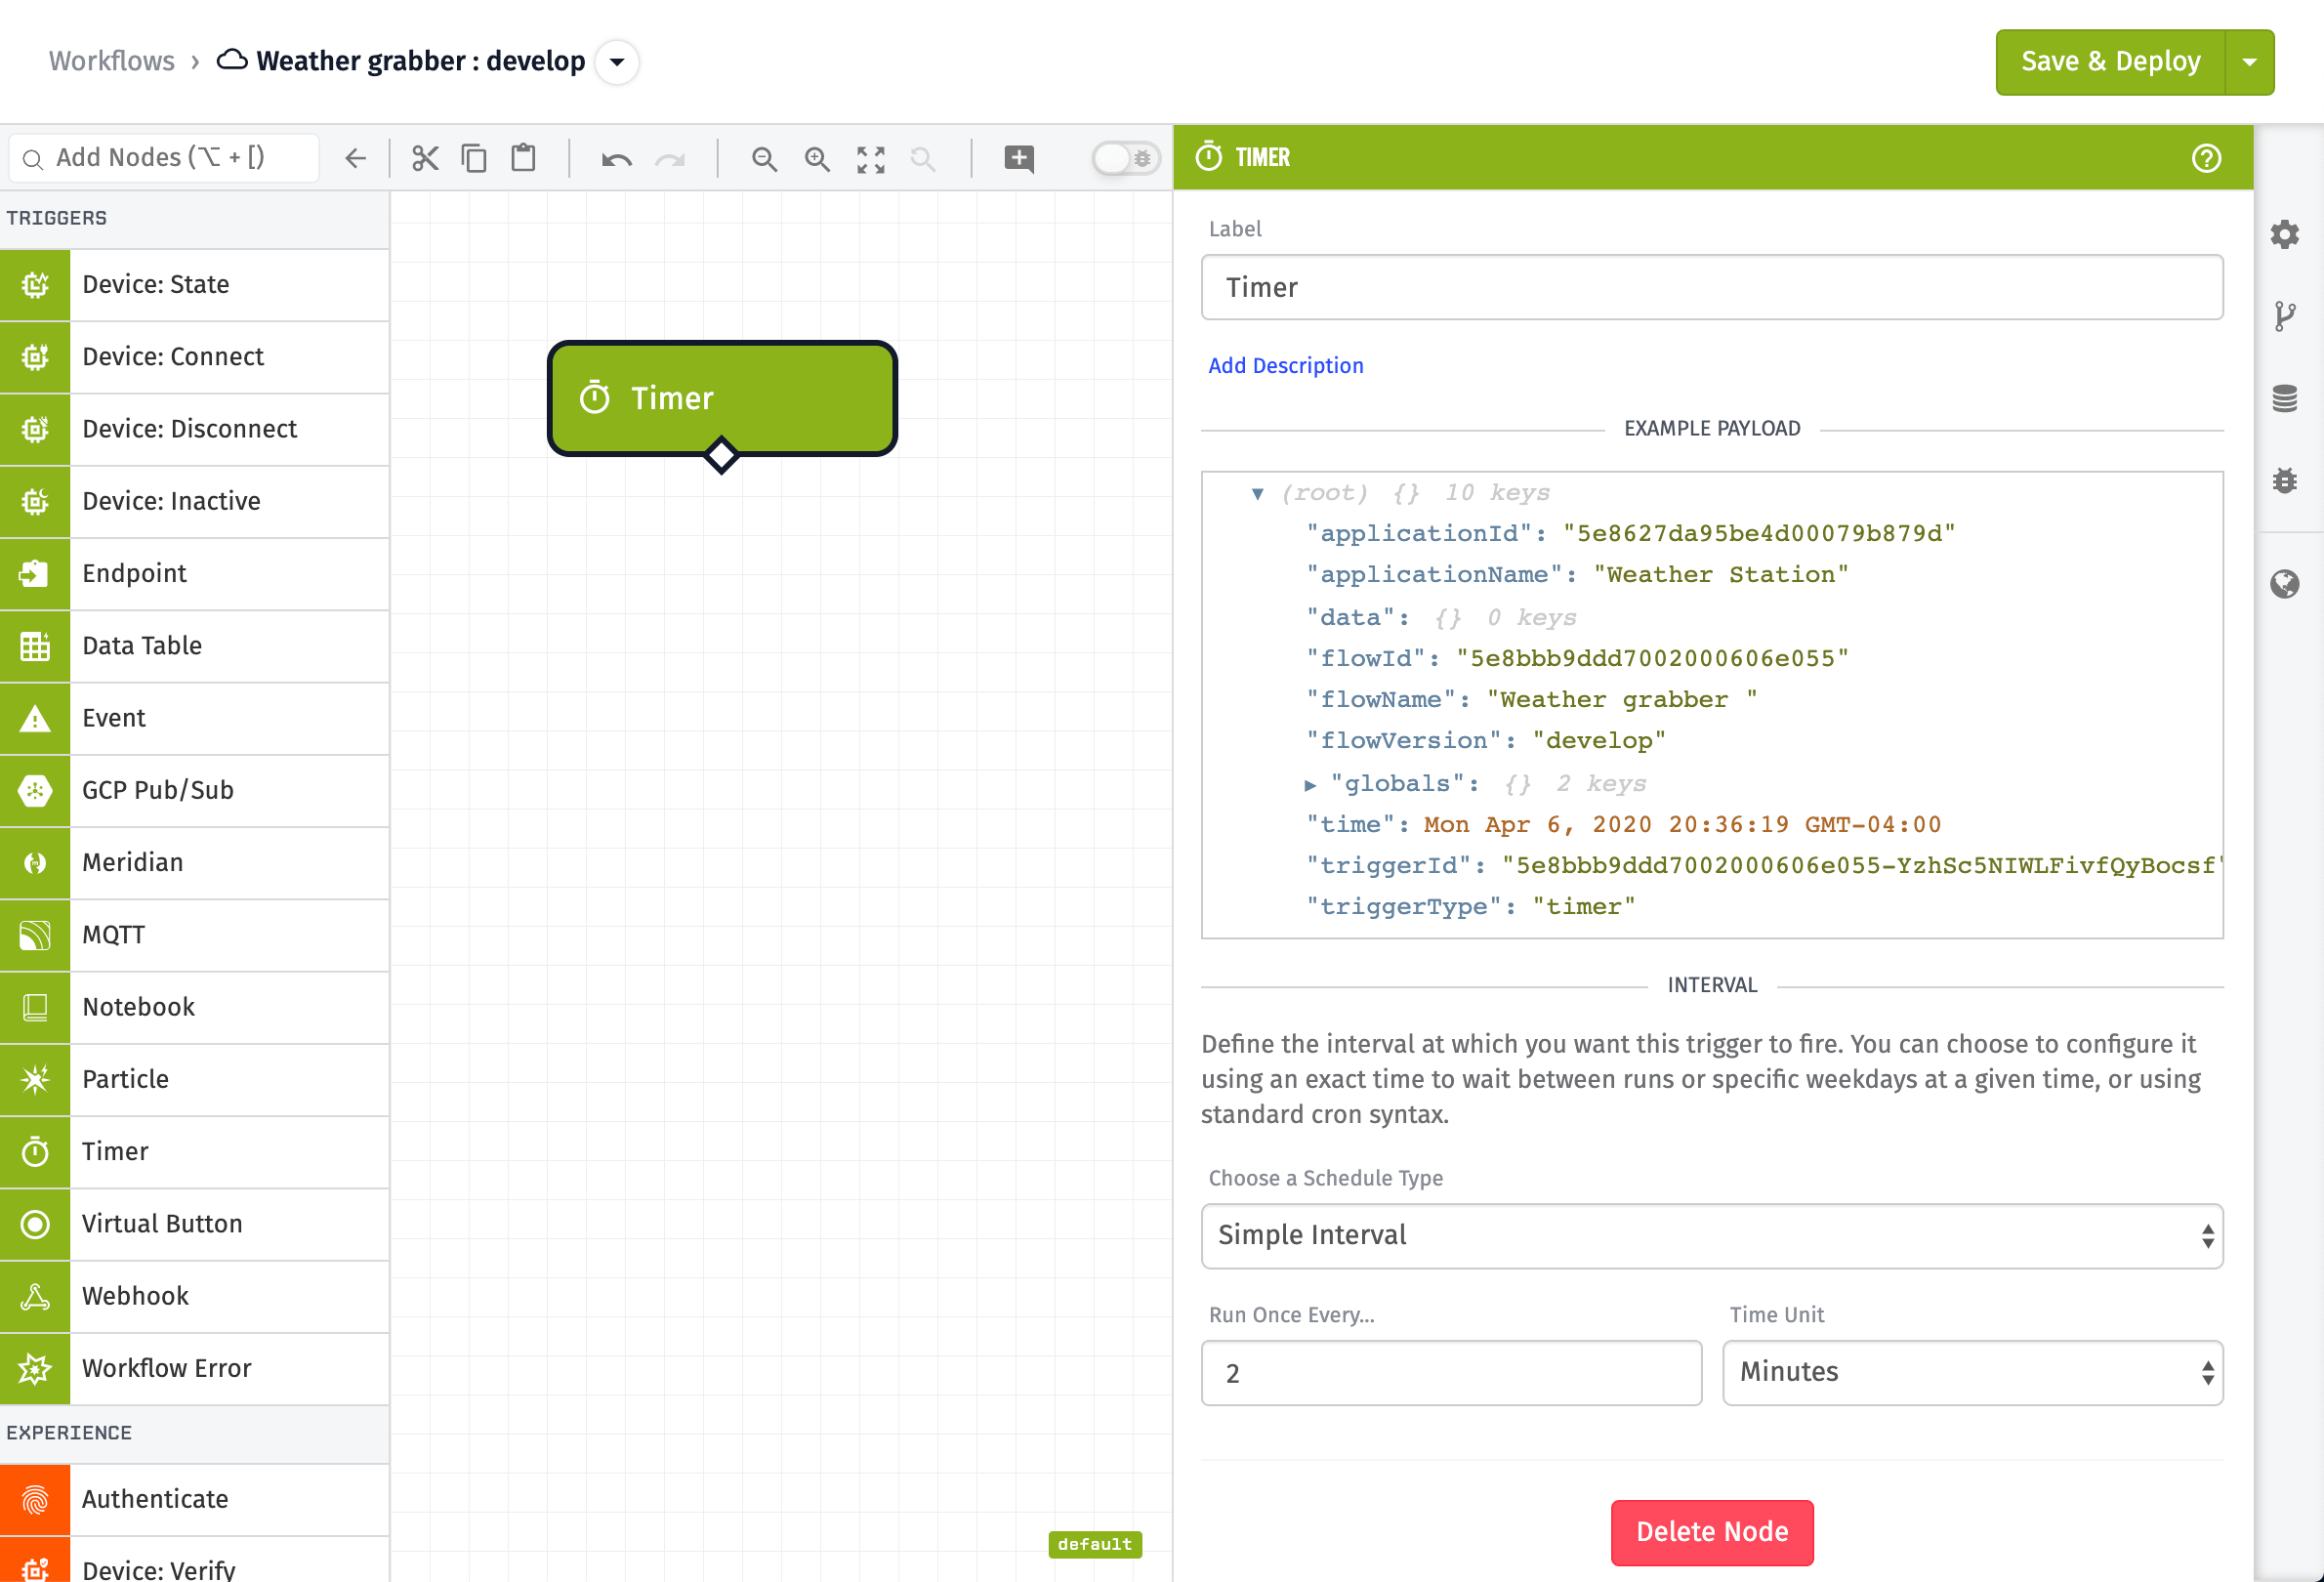
All workflows start with a Trigger. Since we want this workflow to run every couple of minutes to grab weather data, we can use the Timer Trigger.
Drag a Timer Node from the Node Pallet onto the workflow canvas.
The OpenWeather API provides us with 1,000 API requests per day. So, requesting every 2 minutes will only use 720 of those. Within the node configuration, create a "Simple Interval" that will run every two minutes.
Requesting Data
In order to request data, we need to add a few nodes to the canvas.
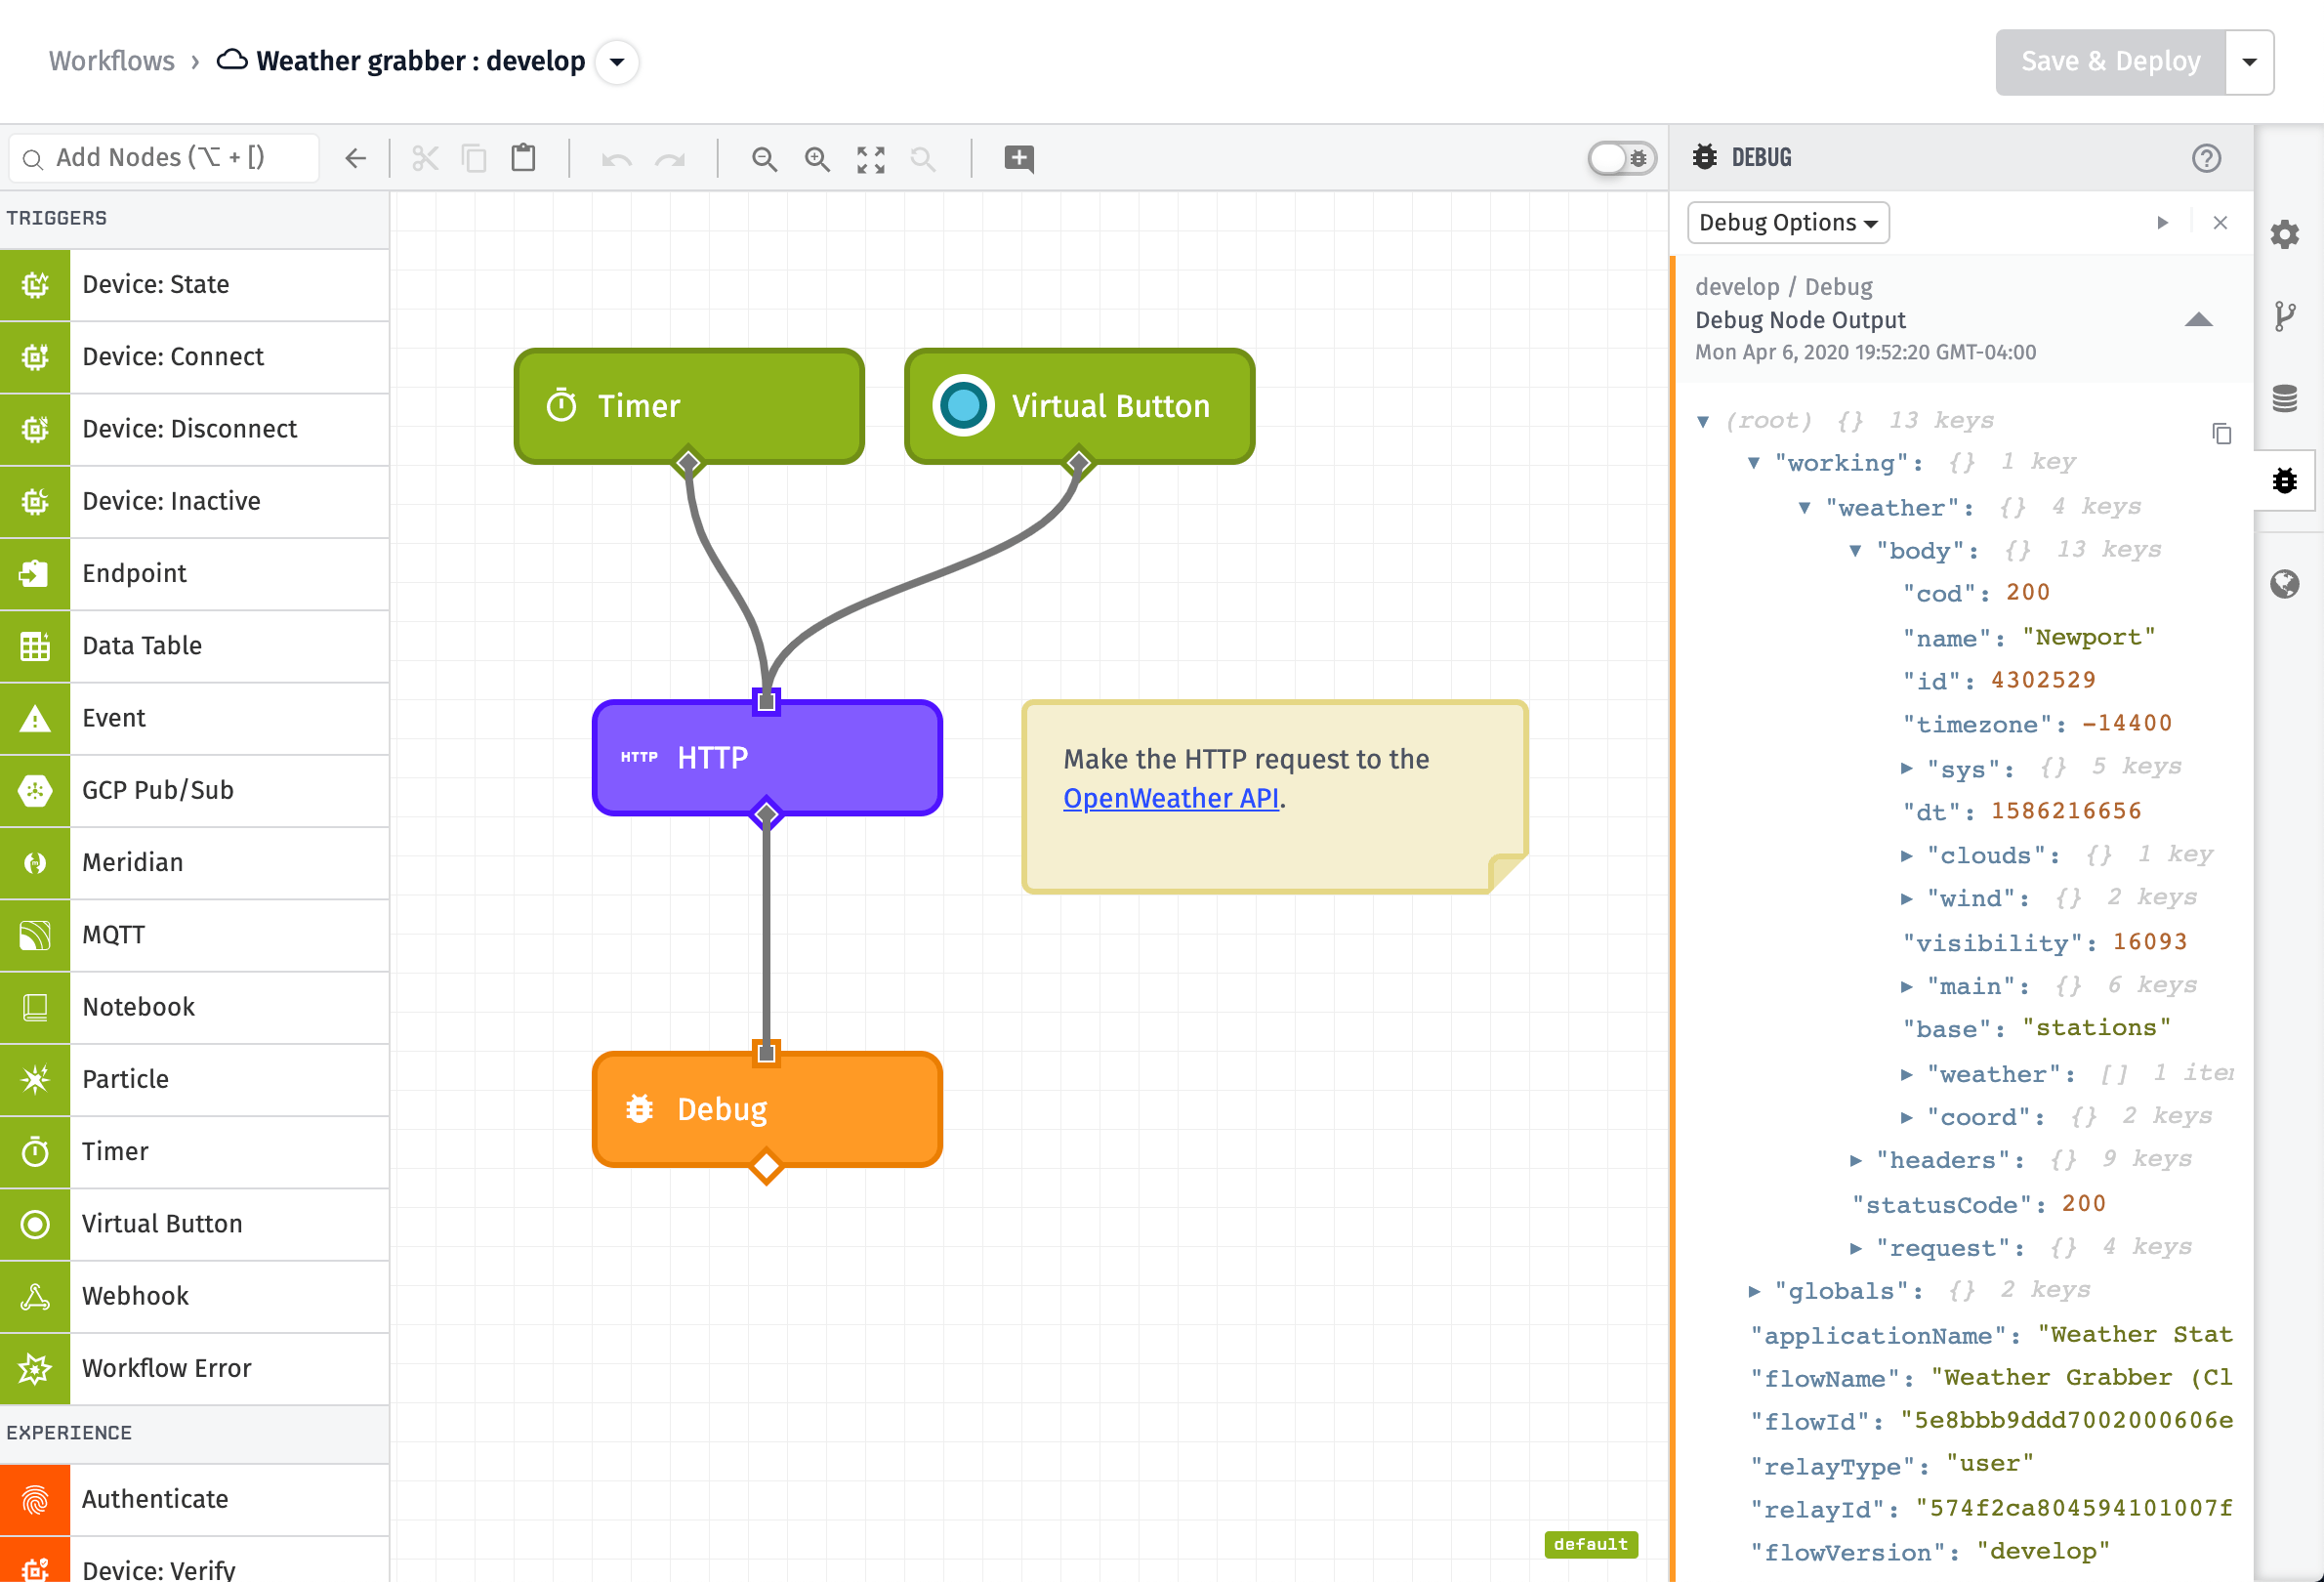
Drag all of these nodes onto the canvas and connect them as shown above:
- The Virtual Button Node - Triggers the workflow with a button instead of waiting for the trigger.
- The HTTP Node - Makes the HTTP request to the OpenWeather API.
- The Debug Node - Prints out the data that was received from the HTTP Node.
This workflow isn't doing everything we need yet. But, we'll use these nodes make a request to the OpenWeather API and see the results.
Configure HTTP Node
Press the HTTP Node to update its configuration.
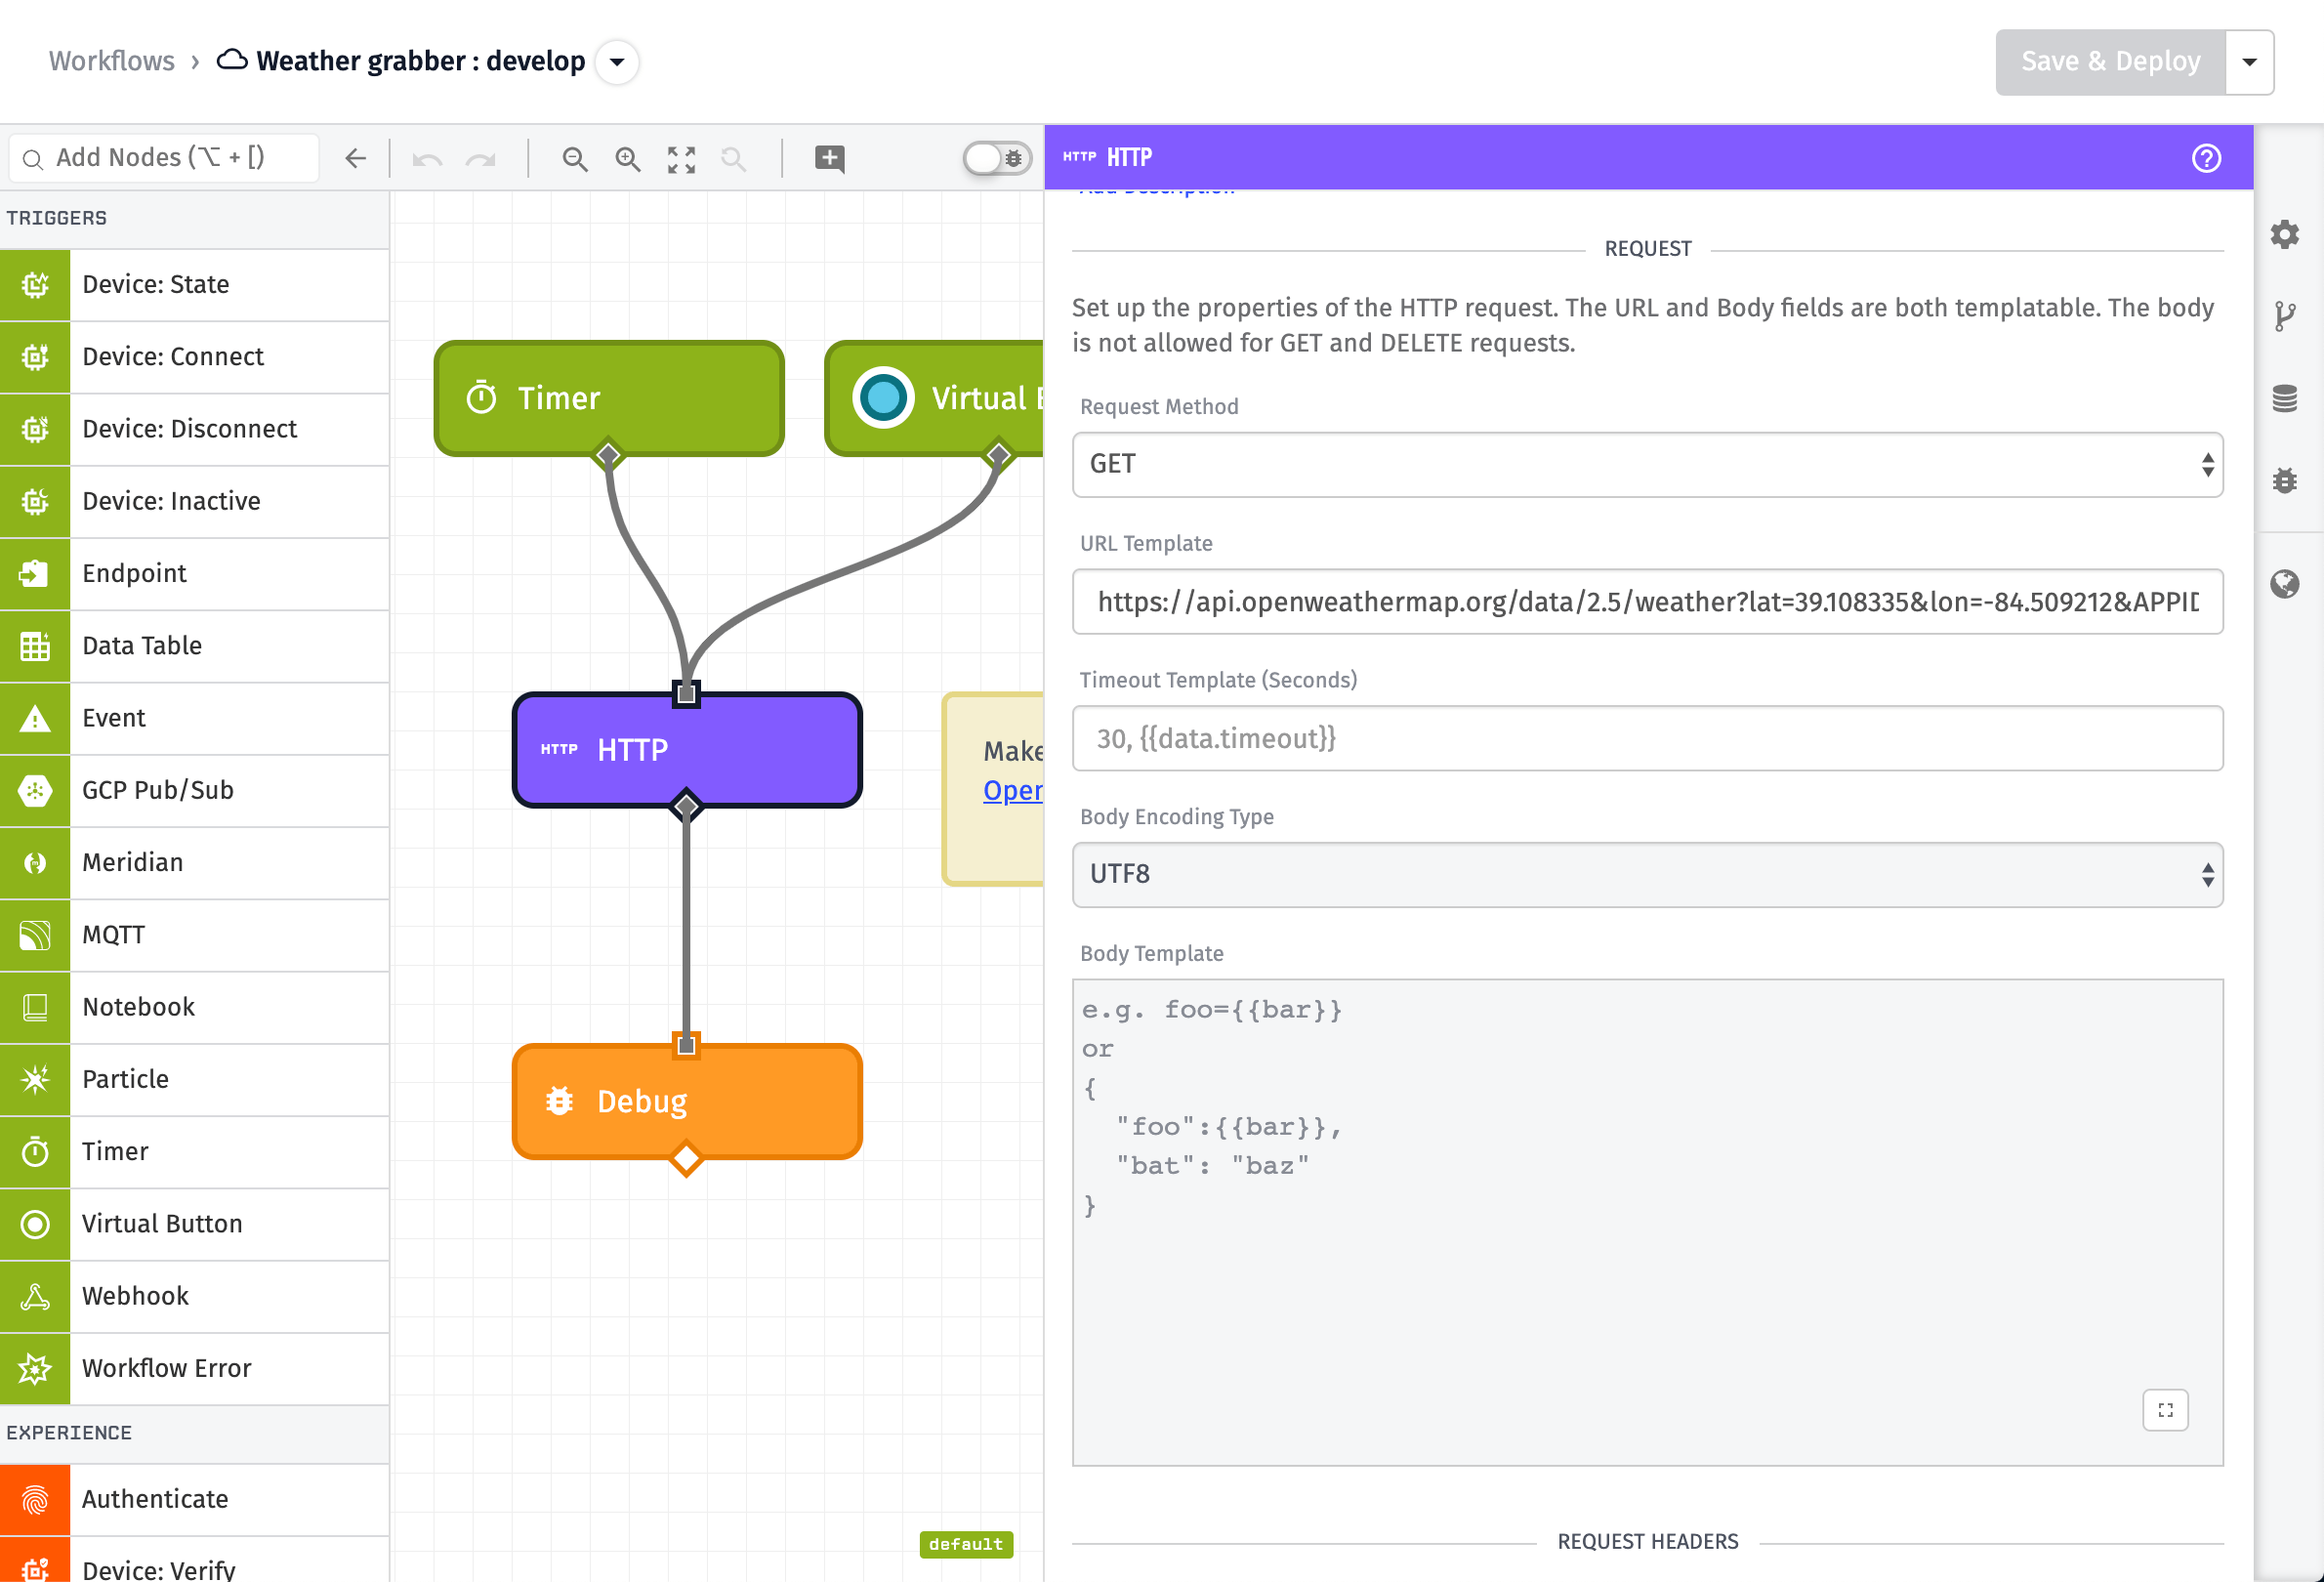
There are two important configuration options for the HTTP Node. The first is the URL and the second is where to store the result.
The URL we configure will be OpenWeather's API endpoint:
https://api.openweathermap.org/data/2.5/weather?lat=LATITUDE&lon=LONGITUDE&APPID=APIKEY
Copy/Paste the above text as your URL. After, replace APIKEY with the key you obtained in Step 1 after registering for the OpenWeather API.
Next, replace the LATITUDE and LONGITUDE values. They are the coordinates, in decimal degrees, of the location to request. You can use MyLocation.org to get these coordinates.
Here's the coordinates of WEGnology's headquarters if you'd like to use these:
https://api.openweathermap.org/data/2.5/weather?lat=39.108335&lon=-84.509212&APPID=APIKEY
Define Payload Path
The second required configuration parameter for the HTTP Node is the location on the payload to put the result.
Workflows pass a JSON payload through each node in the workflow. The job of each node is to add, remove, or modify the payload as needed as it flows through them. In this case, we want to make a request to the OpenWeather API and add it to the payload.
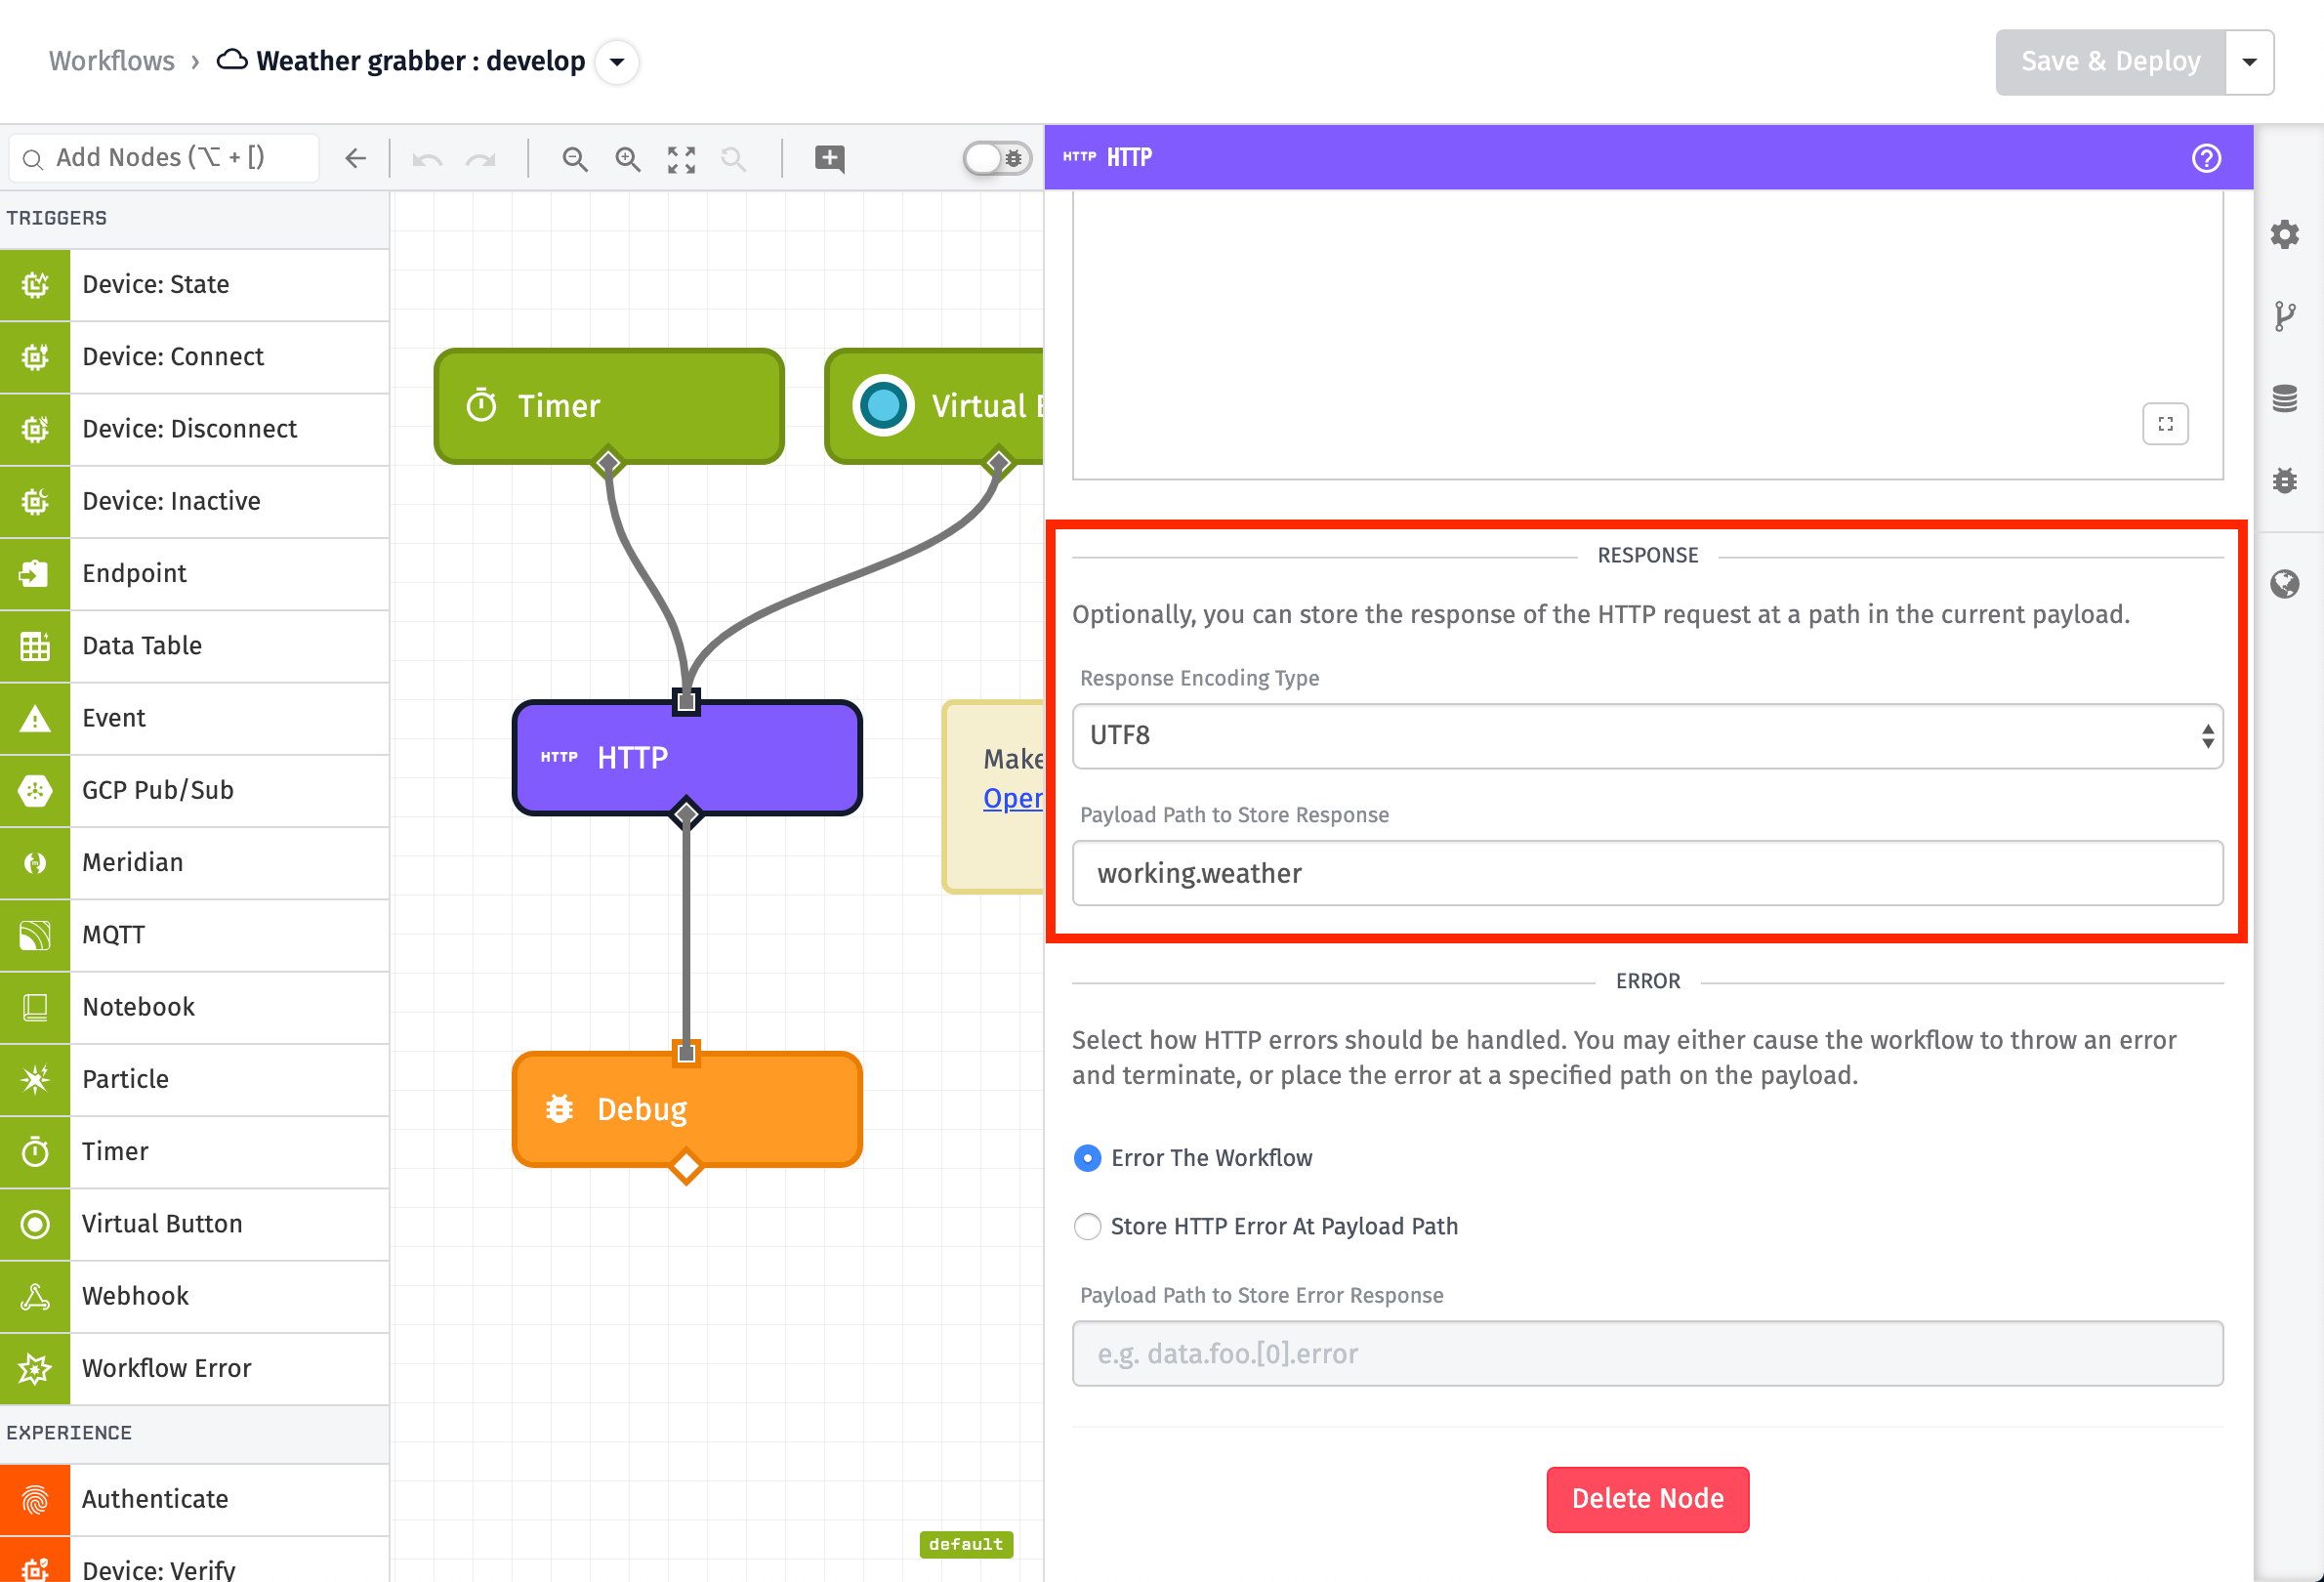
Configure the "Payload Path to Store Response" to be working.weather.
This means that, at the path of working.weather on the payload we will find the response from the OpenWeather API.
When using the Workflow Engine, it's helpful to have standards. Though you can put data anywhere you want on the payload working is a best practice we settled on at WEGnology. Everything in working represents data that we are actively manipulating a workflow. Using working you can always assume that the rest of the payload is untouched, and you can use those values in other nodes without worry.
Now that we've configured our HTTP Node, it's time to see the workflow in action.
Deploy Workflow
To deploy the workflow, select the "Save & Deploy" button at the top of the workflow canvas.

Your workflow is now running within WEGnology's cloud. You can wait 2 minutes for the Timer Node to start, or simply click the Virtual Button to trigger the workflow.
Once triggered, click the Debug Tab on the right to see the output.
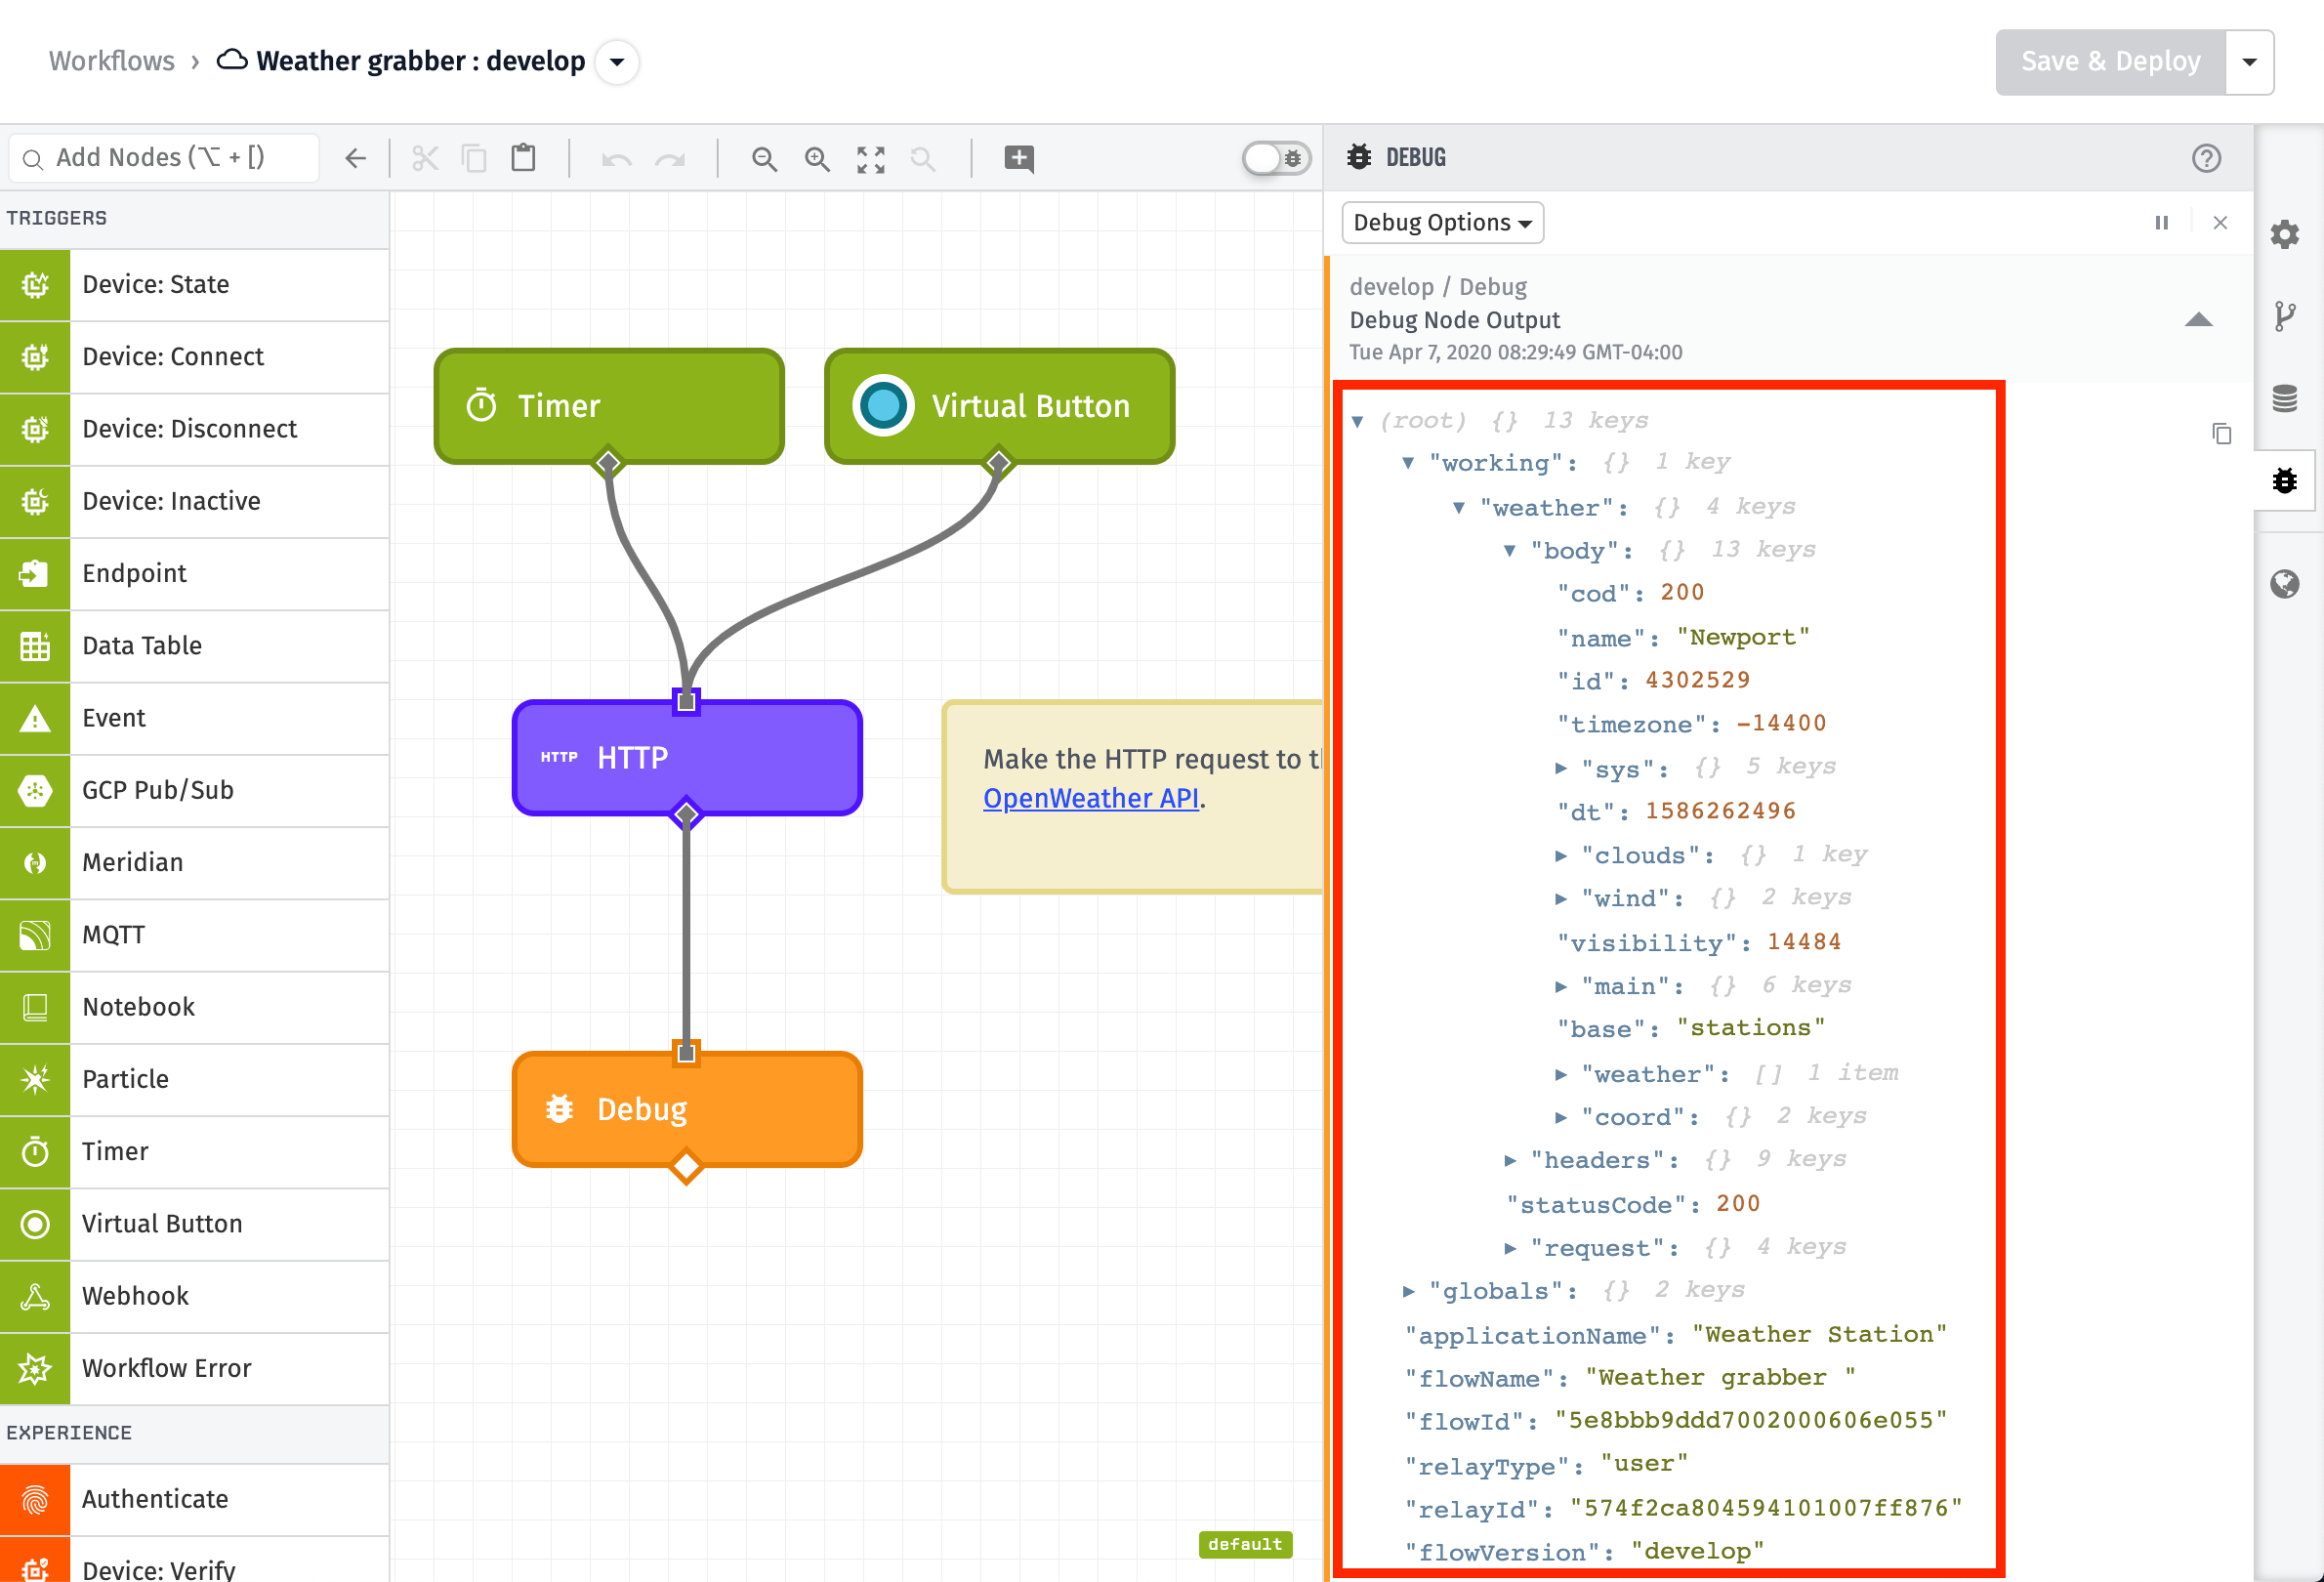
We can now inspect our payload and can see that the result from the OpenWeather API call has been placed on the working.weather field of the payload.
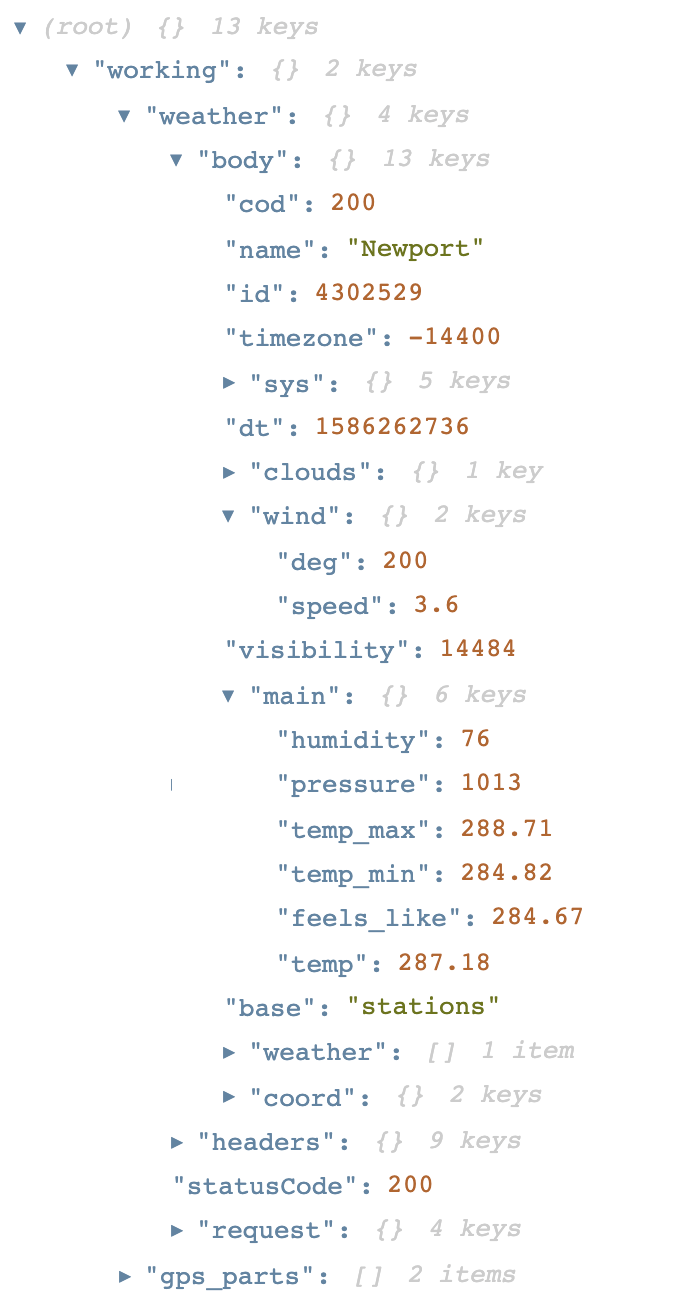
Displayed in the Debug Panel is the payload. At working.weather we can see the result of the HTTP Node, which includes the body of the request, details about the initial request and more.
The Workflow Payload
Here is a sample payload that this workflow would generate:
{
  "working": {
    "weather": { // working.weather
      "body": {
        "cod": 200,
        "name": "Newport",
        "id": 4302529,
        "timezone": -14400,
        "sys": {
          "sunset": 1586304441,
          "sunrise": 1586257934,
          "country": "US",
          "id": 3729,
          "type": 1
        },
        "dt": 1586264536,
        "clouds": {
          "all": 40
        },
        "wind": {
          "deg": 200,
          "speed": 3.6
        },
        "visibility": 14484,
        "main": {
          "humidity": 76, // working.weather.body.main.humidity
          "pressure": 1013,
          "temp_max": 289.15,
          "temp_min": 284.82,
          "feels_like": 284.92,
          "temp": 287.38
        },
        "base": "stations",
        "weather": [
          {
            "icon": "03d",
            "description": "scattered clouds",
            "main": "Clouds",
            "id": 802
          }
        ],
        "coord": {
          "lat": 39.11,
          "lon": -84.51
        }
      },
      "headers": {
        ...
      },
      "statusCode": 200, // working.weather.statusCode
      "request": {
        ...
      }
    }
  },
  "globals": {},
  "applicationName": "Weather Station",
  "flowName": "Weather grabber ",
  "flowId": "5e8bbb9ddd5002000606e055",
  "relayType": "user",
  "relayId": "574f2ca804595101007ff876",
  "flowVersion": "develop",
  "triggerType": "virtualButton",
  "triggerId": "5e8bbb9ddd7002500606e055-RaSYX9851aJ3AhPF7VxQA",
  "applicationId": "5e8627da95be4d000795879d",
  "data": {},
  "time": "2020-04-07T13:07:26.328Z"
}
At working.weather.statusCode we can see the HTTP Status Code of the request. A 200 means the request was successful.
At working.weather.body.main.humidity we can see the humidity data coming from the request.
Now, we can use these values within our workflow logic.
Step 5: Save Weather Data to Device
Now that workflow is running in WEGnology's cloud, we've got weather data being requested every two minutes and adding it to the payload. It's time to start storing it on our device.
To accomplish this, we need to add a few more nodes to the canvas.
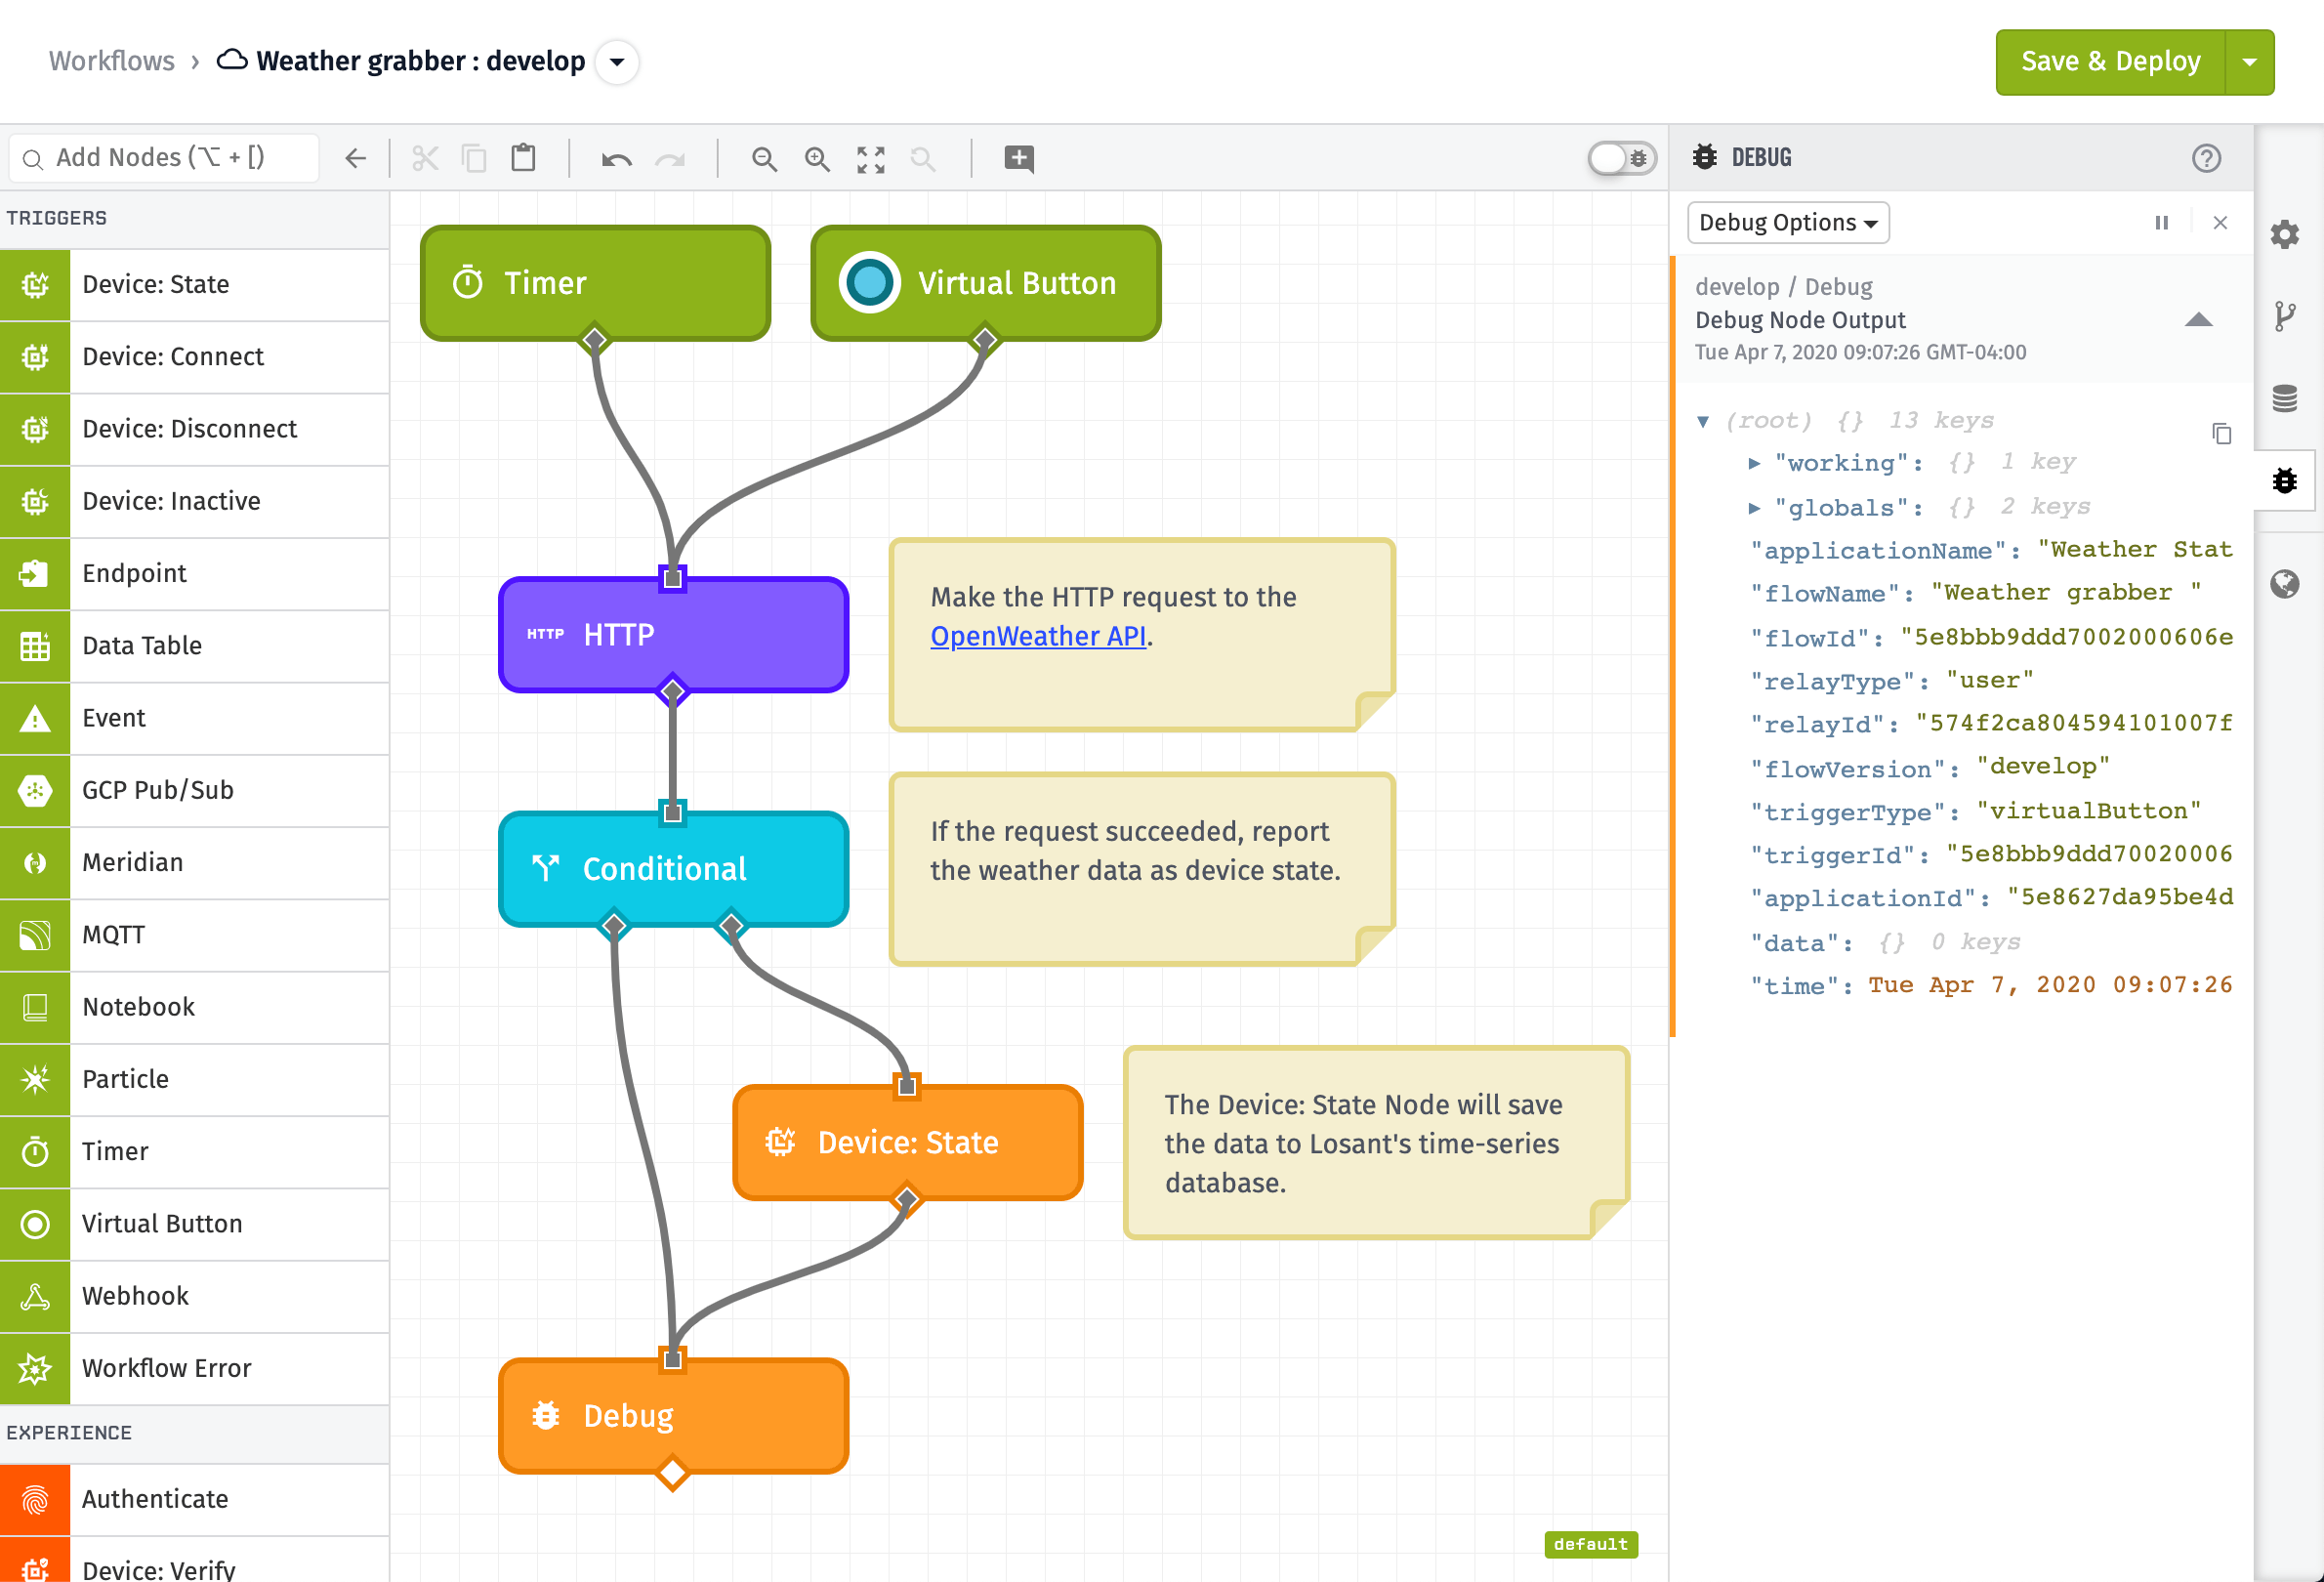
Drag all of these nodes onto the canvas and connect them as shown above:
- The Conditional Node - Checks to make sure the request to OpenWeather was successful before attempting to store the data.
- The Device State Node - Saves the data to WEGnology's time-series database.
When you drag a node over a connector, it will add the node to the series and autoconnect the nodes for you.
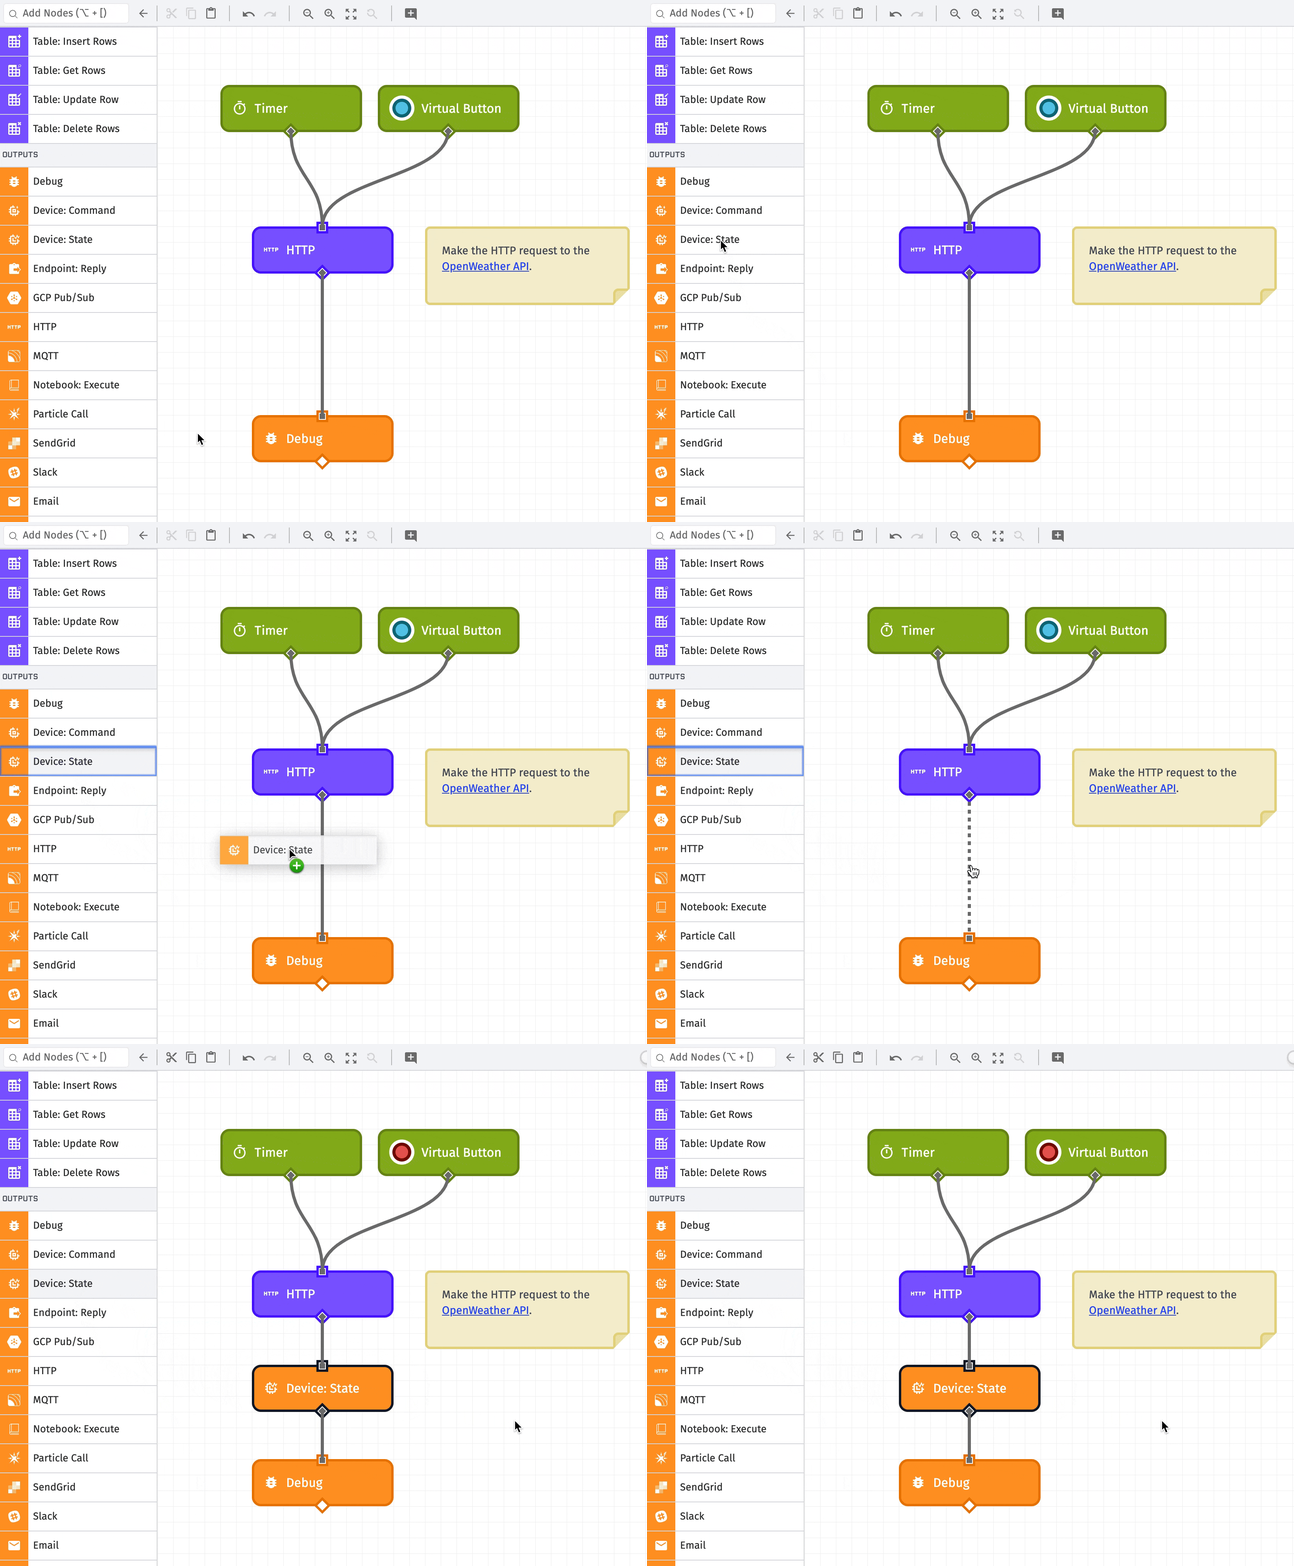
Conditional Node
To make sure the request to the OpenWeather API was successful before we attempt to save the data, we can use the Conditional Node to make sure the status code of the request was 200.
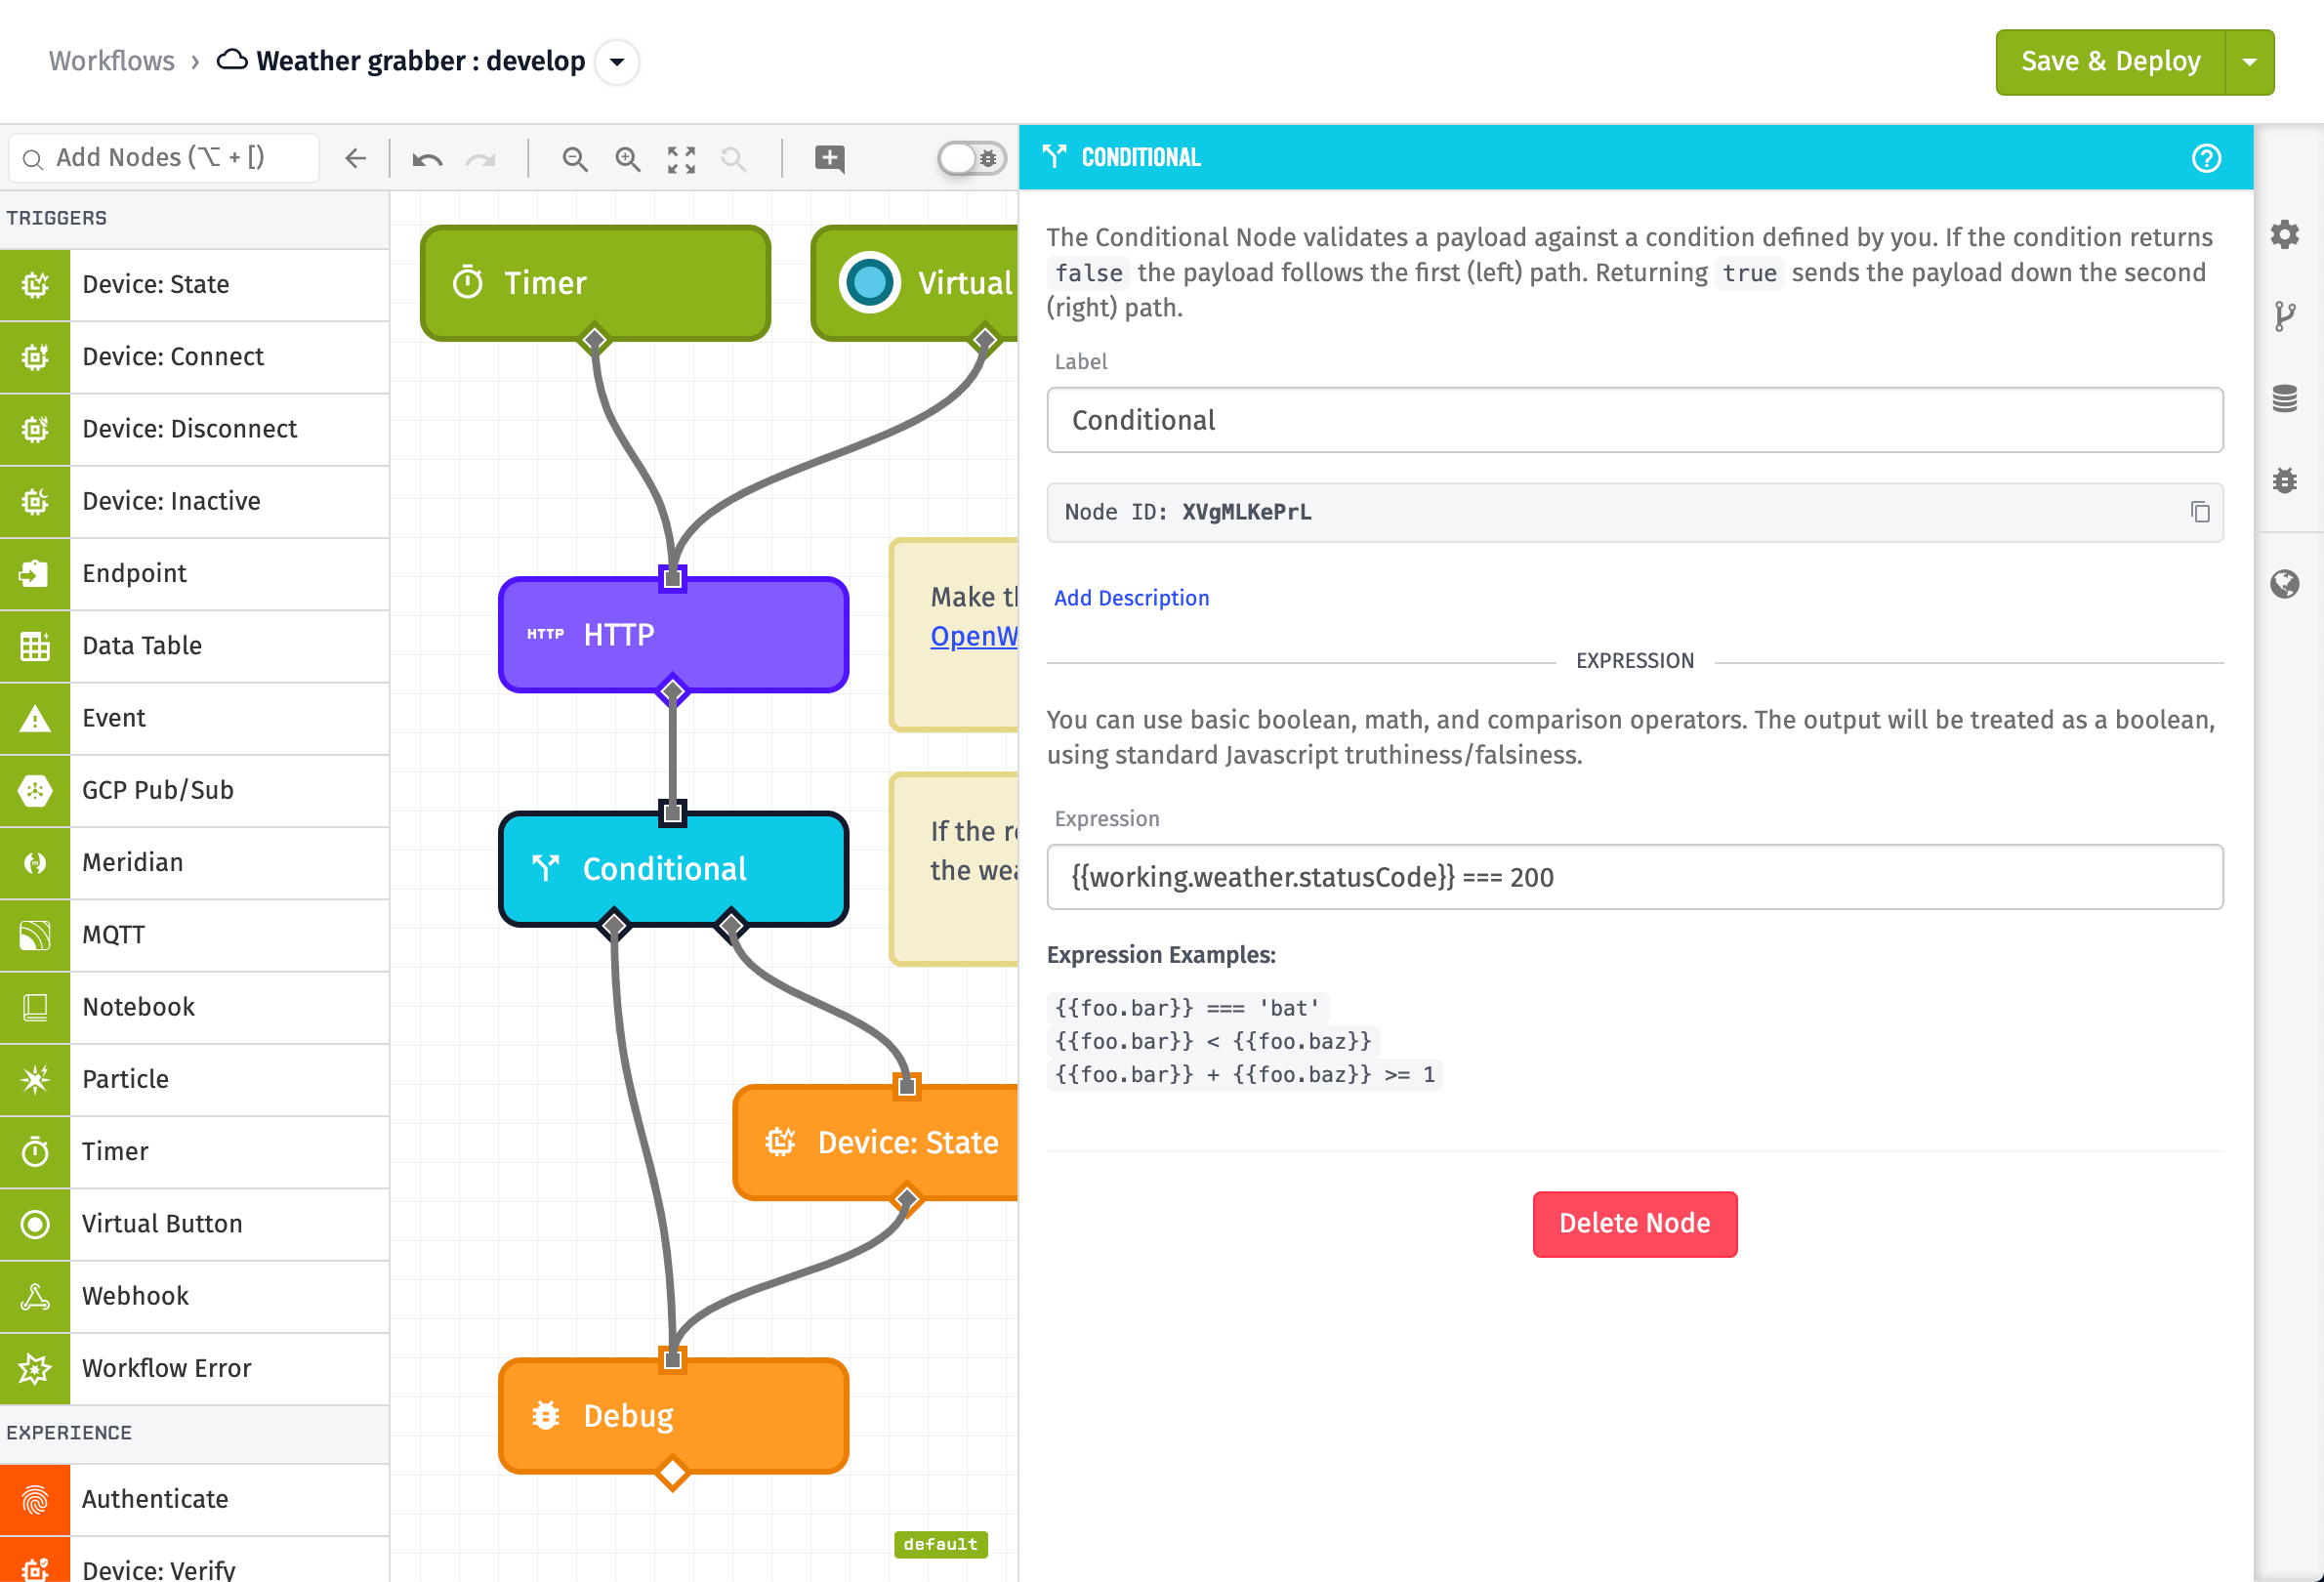
Use the following Expression in the Conditional Node to perform this check:
{{working.weather.statusCode}} === 200
The {{ }} syntax you see is Handlebar Templating. Templating is very powerful and used throughout the Workflow Engine. It allows us to inject values of the payload into the expression.
Expressions are always evaluated as true or false. Once this workflow runs, the above will be evaluated as:
200 === 200 // true
If the expression is true, the Conditional Node will take the right path. In this case, the right path means our request to the weather API was successful. Conditional Nodes are a great way to do "if this than that" logic.
Device State Node
The Device State Node saves the data to WEGnology's time-series database.
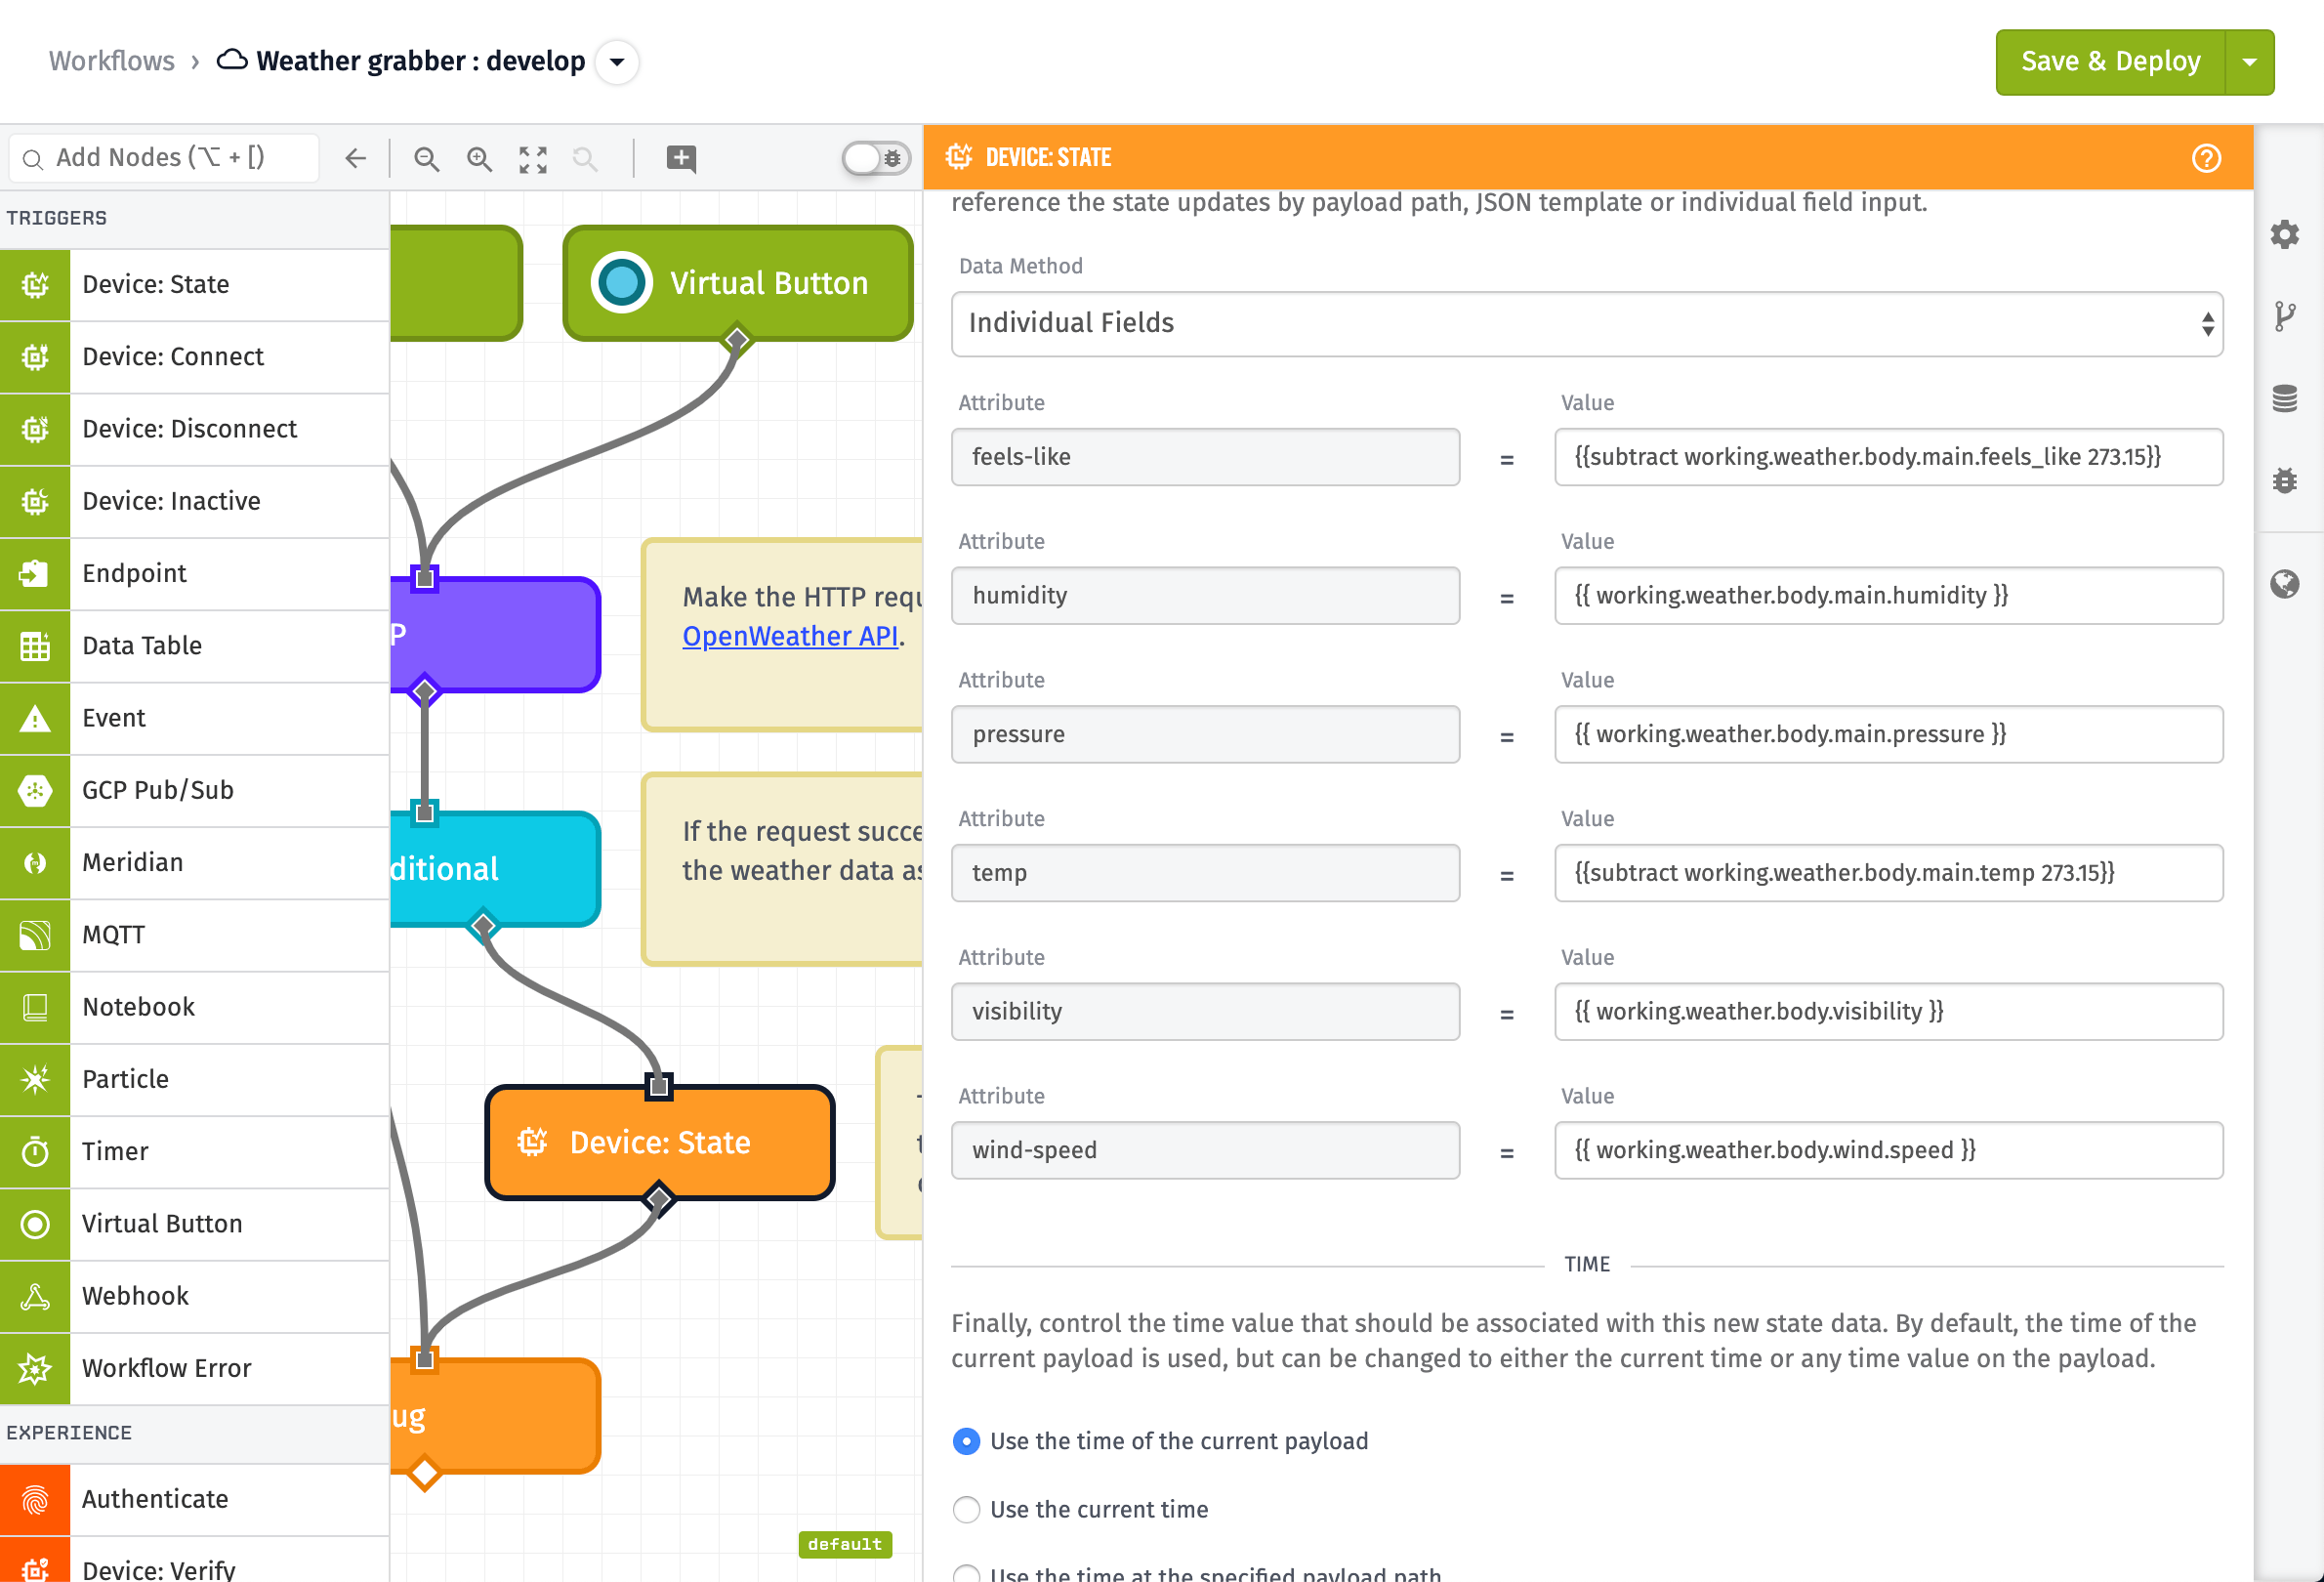
The Device State Node requires you to select the device to report as. Select the device you created earlier.
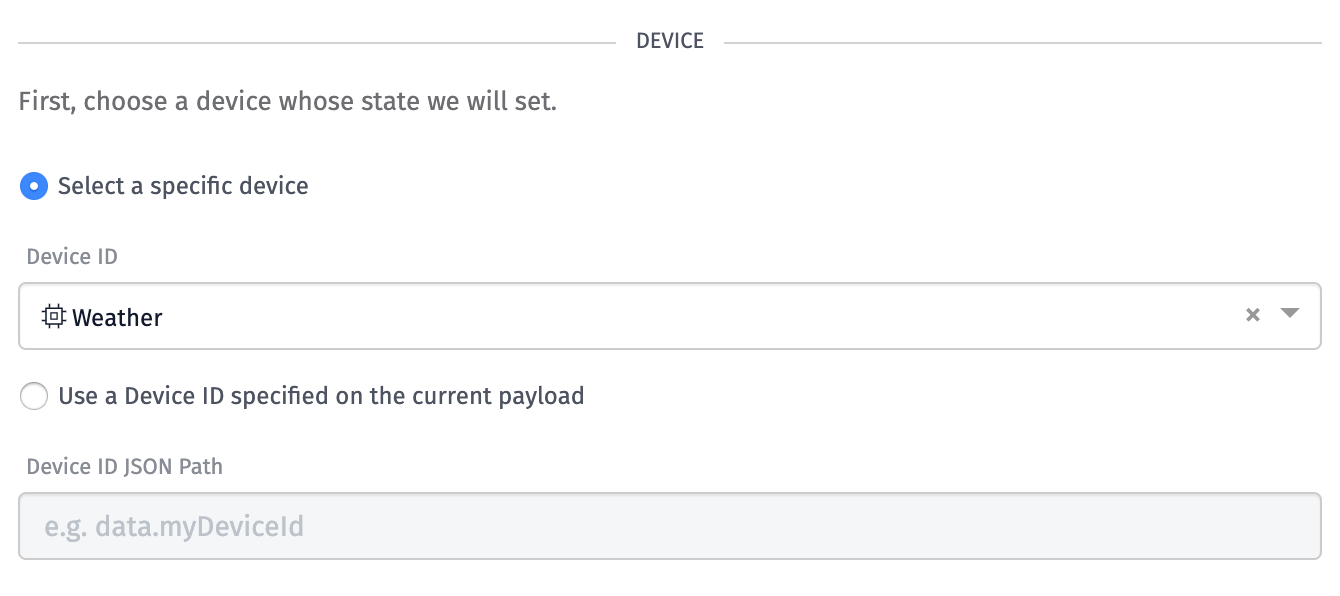
Now, we can connect the data we've received from the OpenWeather API to the attributes we've defined for our device. Since our values are on the payload, we can use templating to reference them.
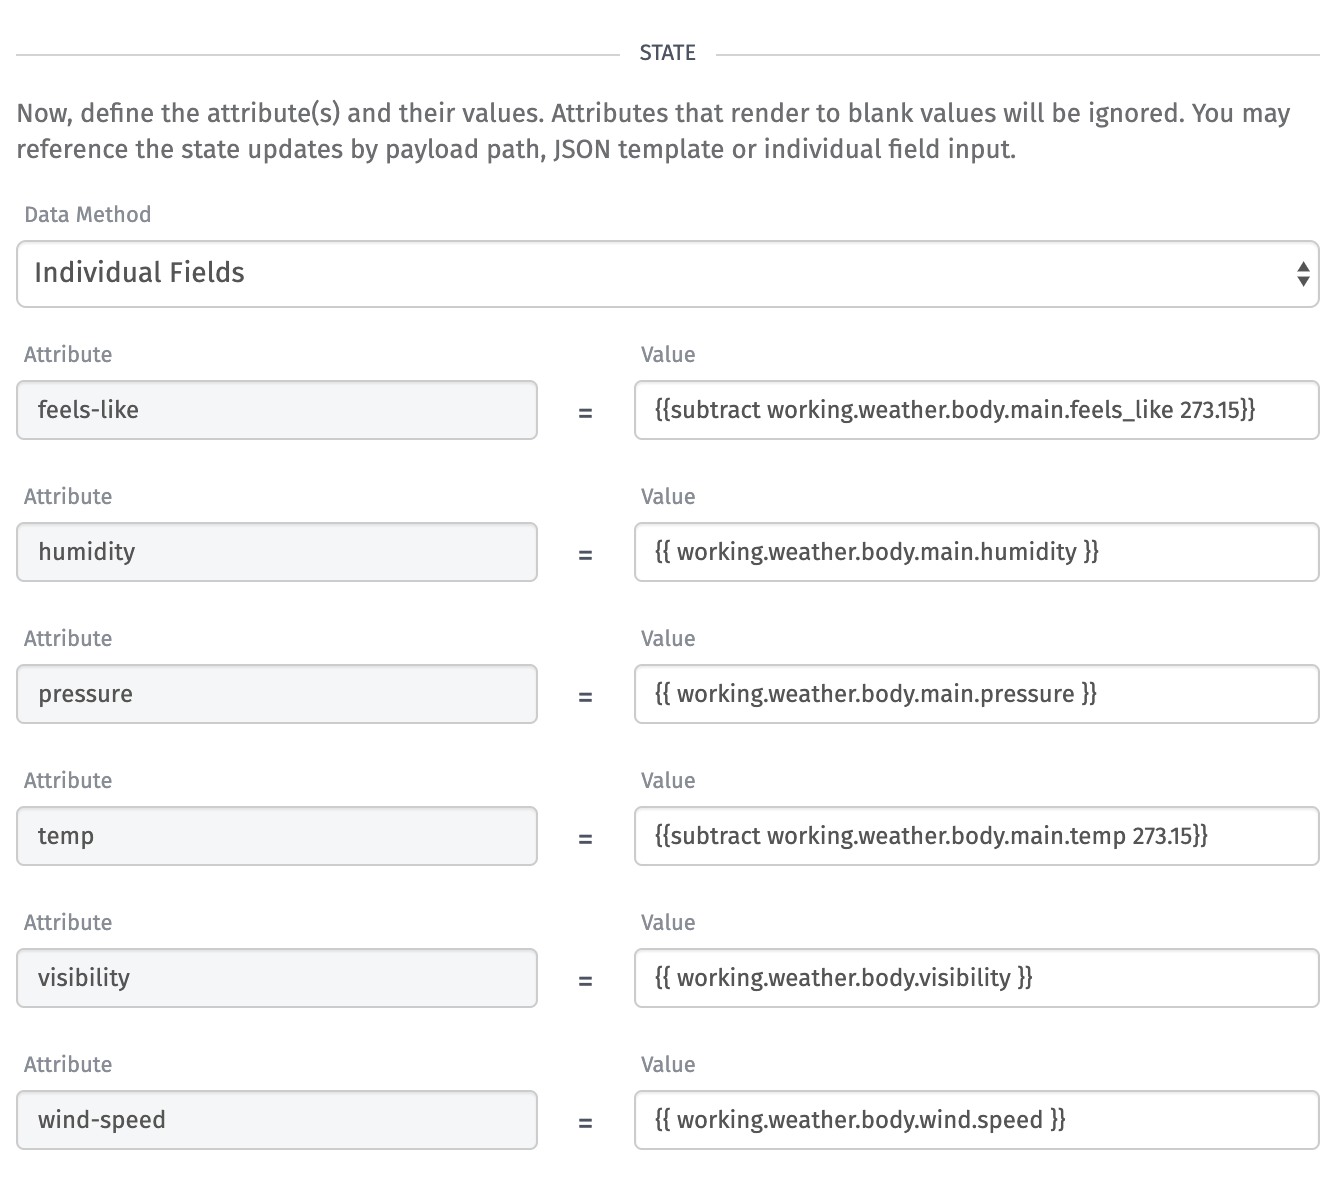
As shown above, assign values to our various attributes by using the following templates:
- feels-like :
{{subtract working.weather.body.main.feels_like 273.15}} - humidity :
{{ working.weather.body.main.humidity }} - pressure :
{{ working.weather.body.main.pressure }} - temp :
{{subtract working.weather.body.main.temp 273.15}} - visibility :
{{ working.weather.body.visibility }} - wind-speed :
{{ working.weather.body.wind.speed }}
As you can see, we are using templating to pull the value of the humidity out of the payload:
As you saw with the Conditional Node, when using templates within expressions, we expect the result to be true or false. Here, we are using String Templates. It will simply place the value at that payload path as text.
In this case, it allows us to set each attribute to its corresponding value on the payload.
Notice the following template:
{{subtract working.weather.body.main.temp 273.15}}
This is using Handlebar Helpers. The helper here is subtract. The temperature reported by the OpenWeather API is in Kelvin. So, to convert to Celsius, we need to subtract 273.15.
Helpers allow us to easily do this within templating. Here, we can use the {{subtract}} helper to properly convert our value.
So far we have configured our workflow to:
- Request data from the OpenWeather API.
- Verify that our API request was successful.
- Report the weather data from the API as device state.
Now it's time to test and run what we've put in place! Deploy your workflow.

Every time the timer triggers, or you press the Virtual Button, the Device State Node will publish the state attributes to your device.
Verifying Device State
You can verify that the state is being reported and saved to the device by navigating to your device page log panel.
You can view a real-time stream of events in the Device Log panel, or navigate to the State Report History panel to view the most recent device states published to that device.
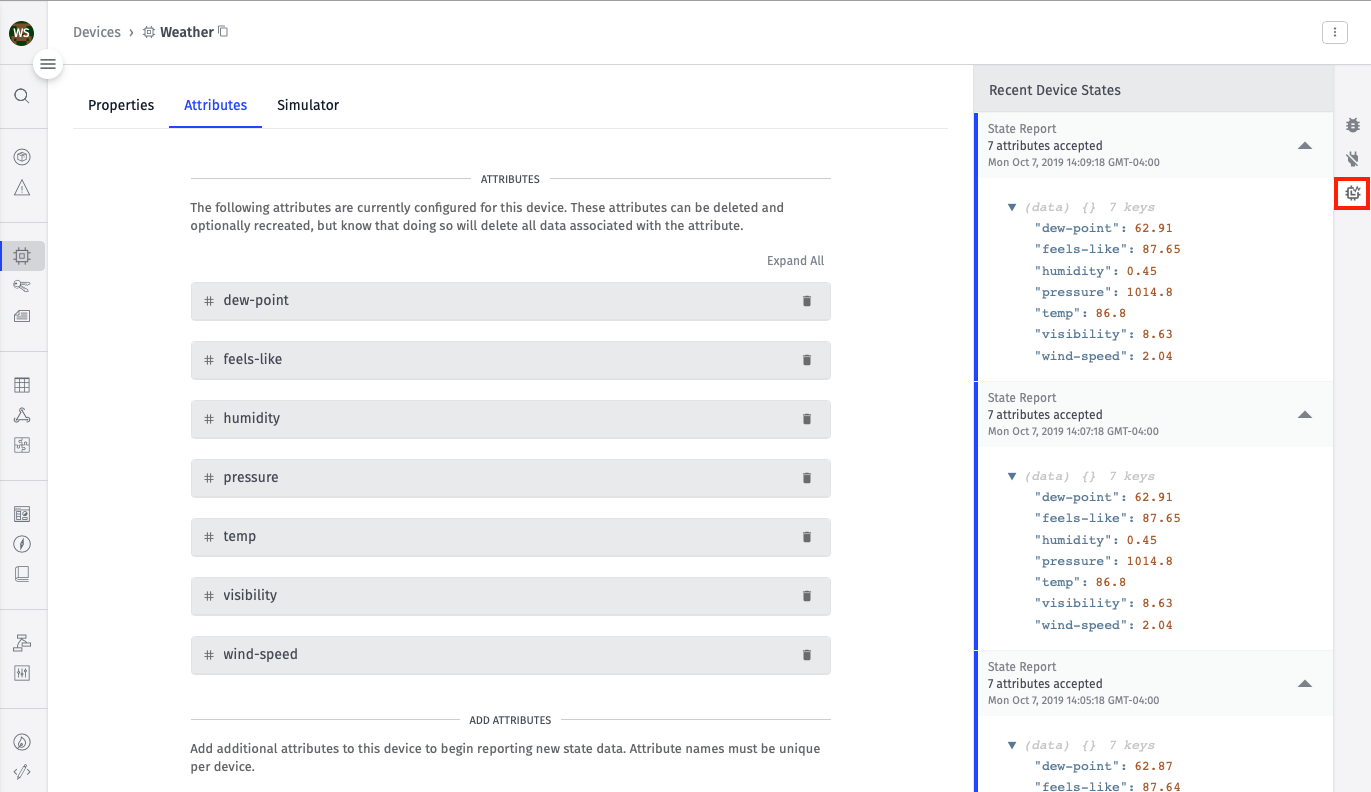
There, you should be able to see the data we reported from our workflow. You can also view the device data stored in WEGnology's time-series data base using the Data Explorer.
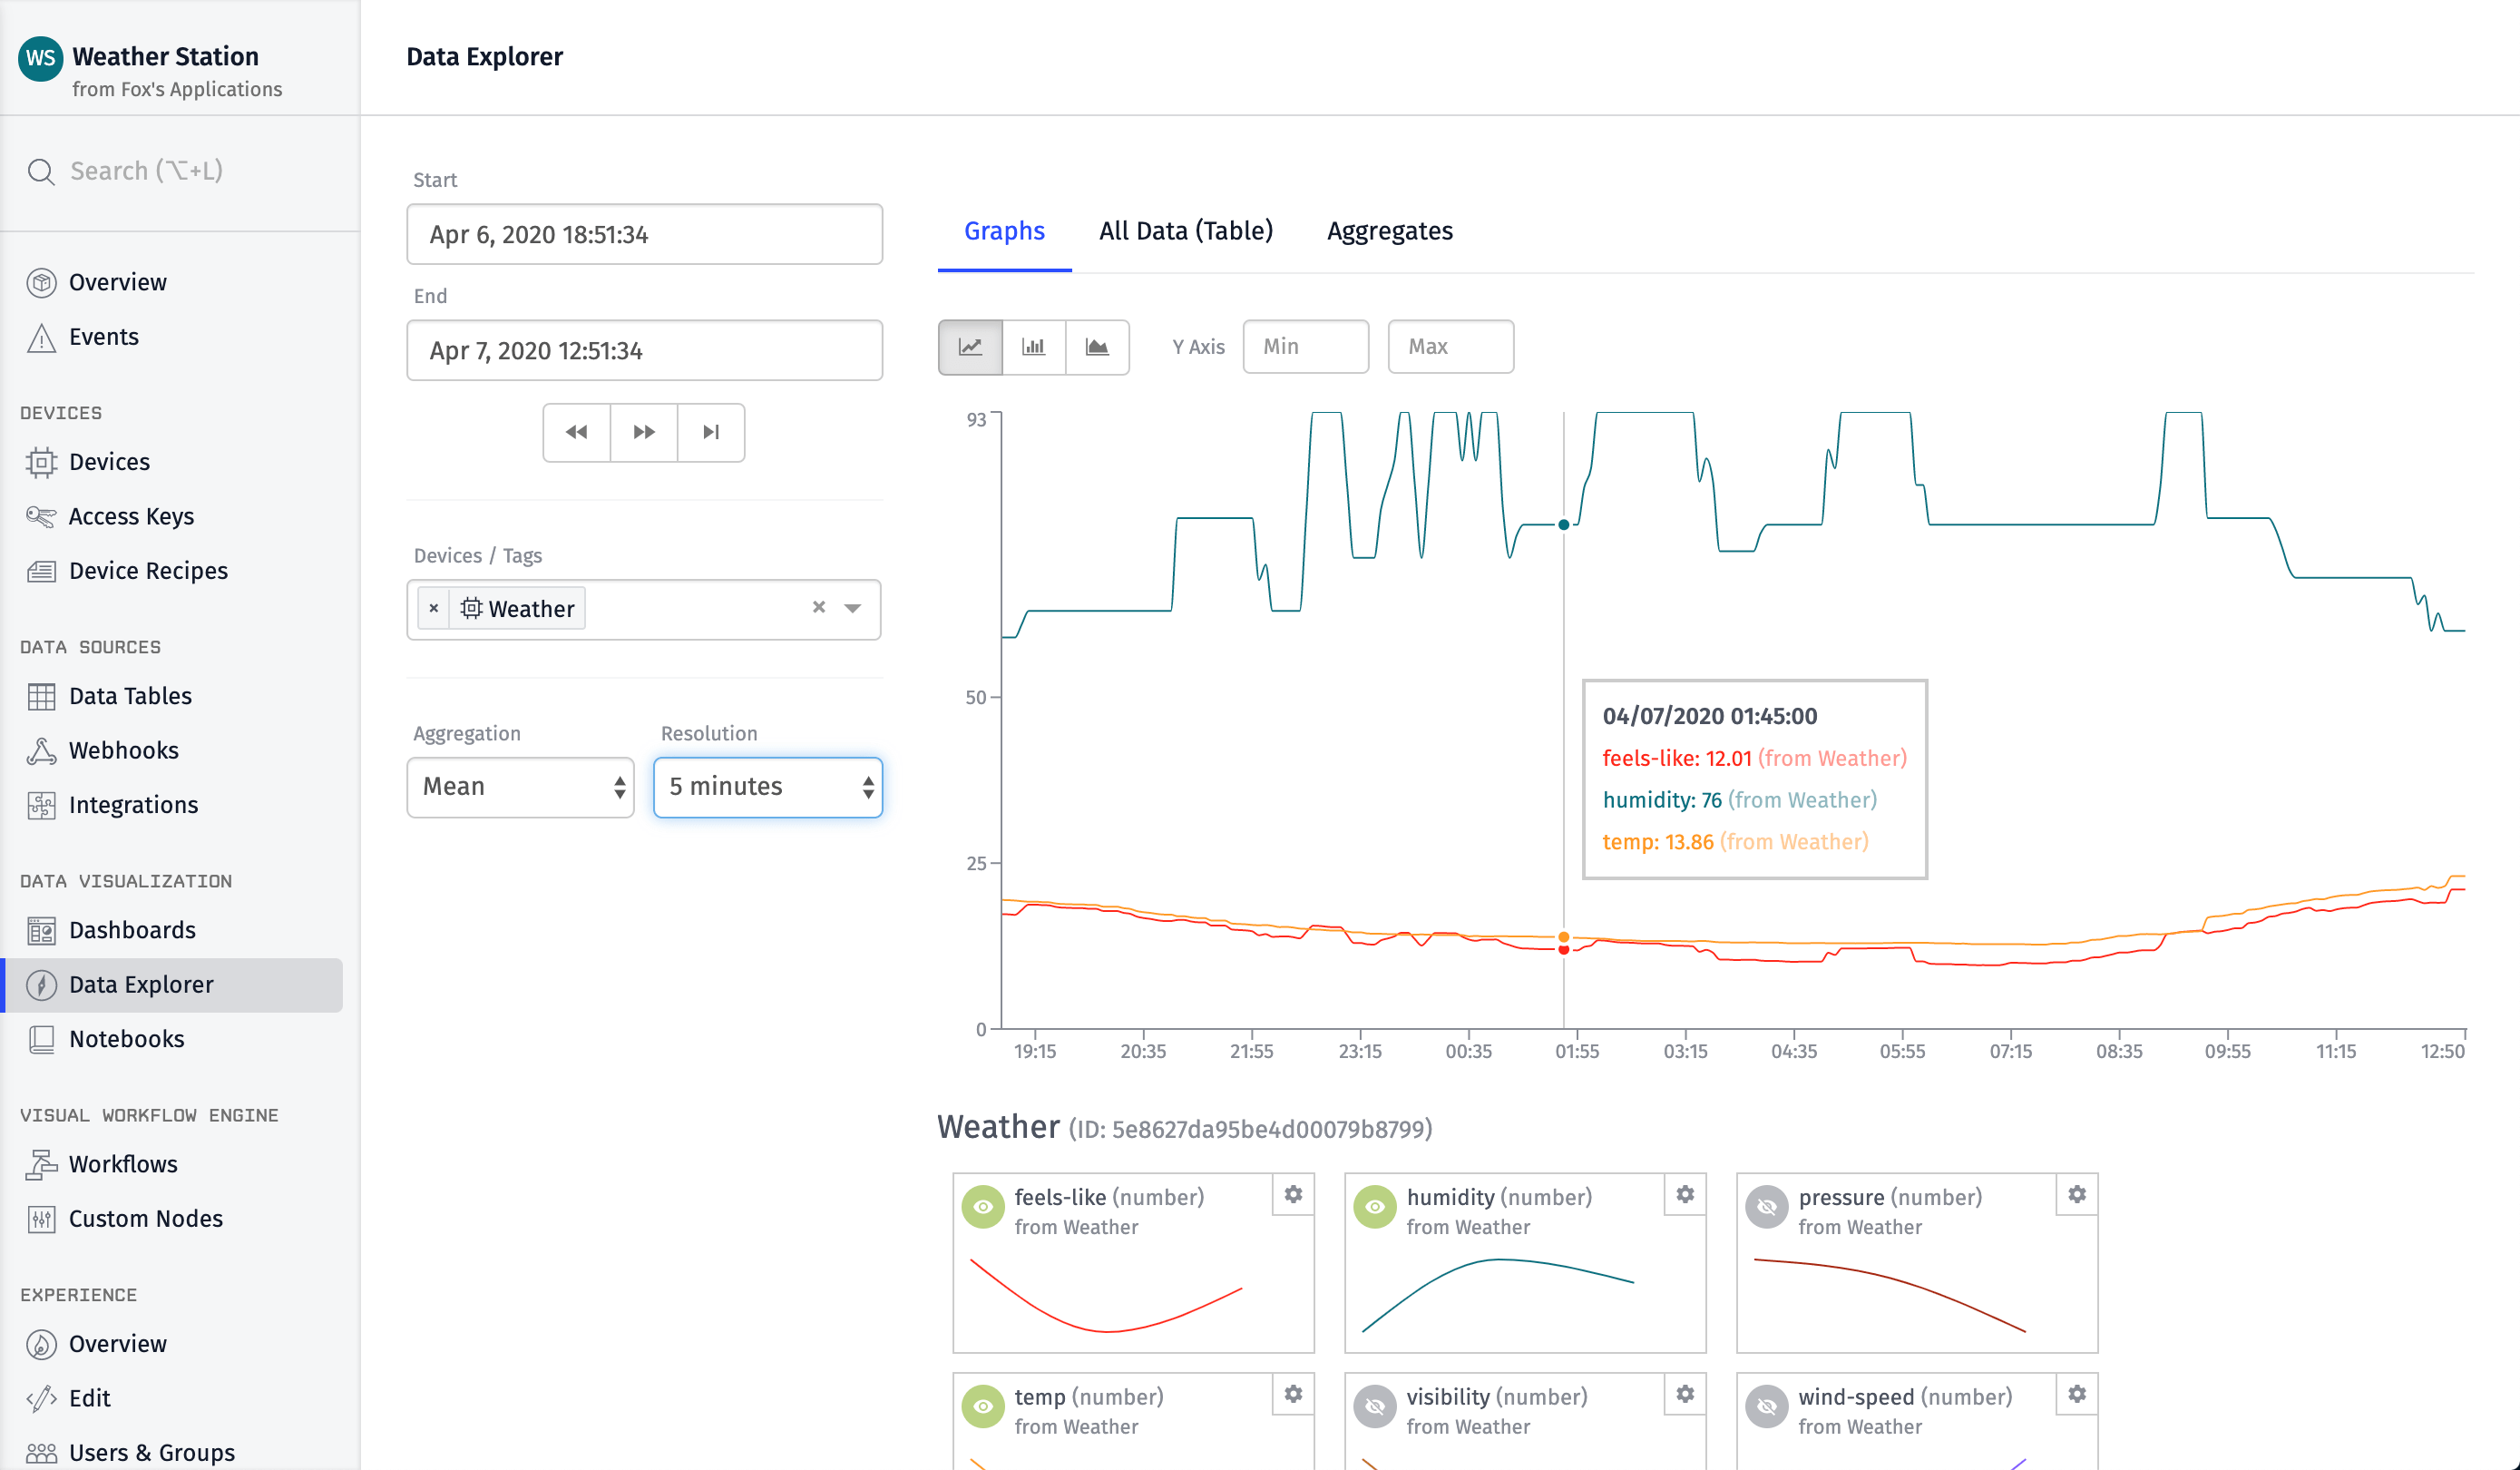
Now, it's time to visualize that data using Dashboards.
Step 6: Create a Dashboard
Now that we've got weather data being stored, we can visualize it using a WEGnology Dashboard. Just like workflows, dashboards are super easily and very flexible to customize with drag and drop.
Here is a preview of the dashboard we are creating:

A dashboard is made up of blocks. Each block gives you a different way to present your data. Let's create our dashboard and add our first block.
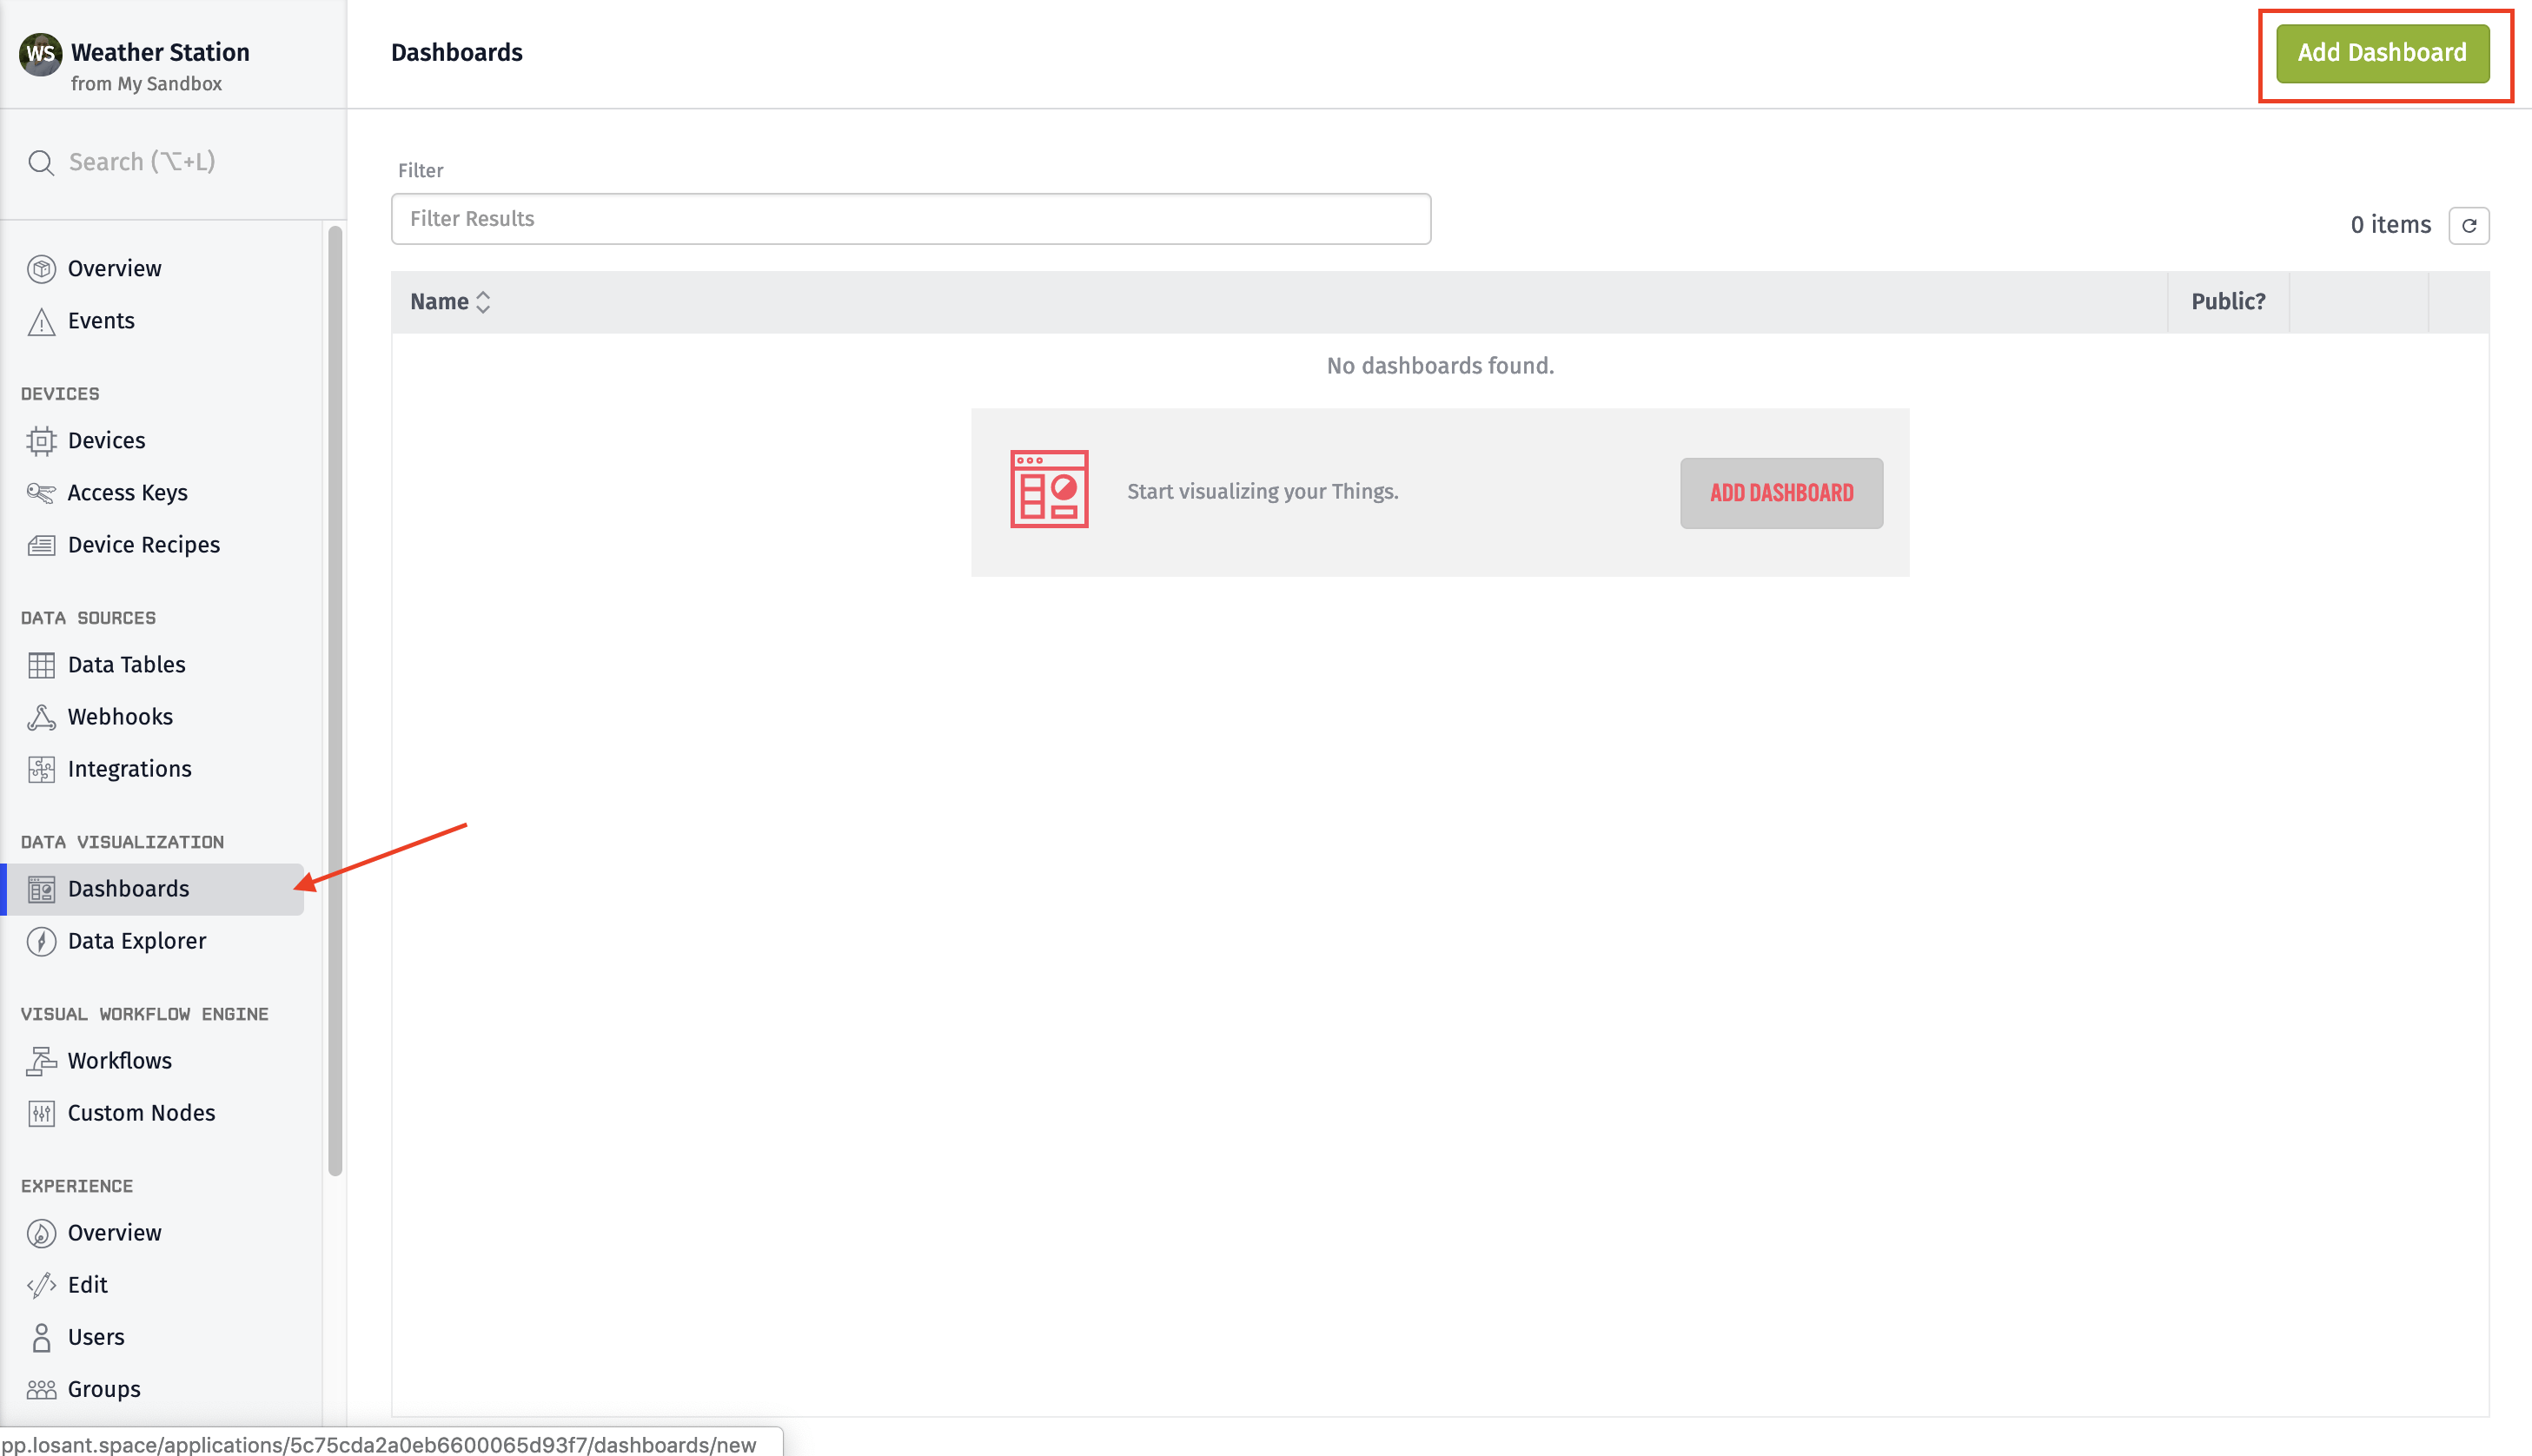
To begin, create a new dashboard by selecting "Dashboards" from the application menu and then select "Add Dashboard".
Display Temperature
The first block we are going to add is the Gauge Block. The Gauge Block displays a single attribute value, either as a number or as a visual representation in a dial. In this case, we can use it to show the current temperature.
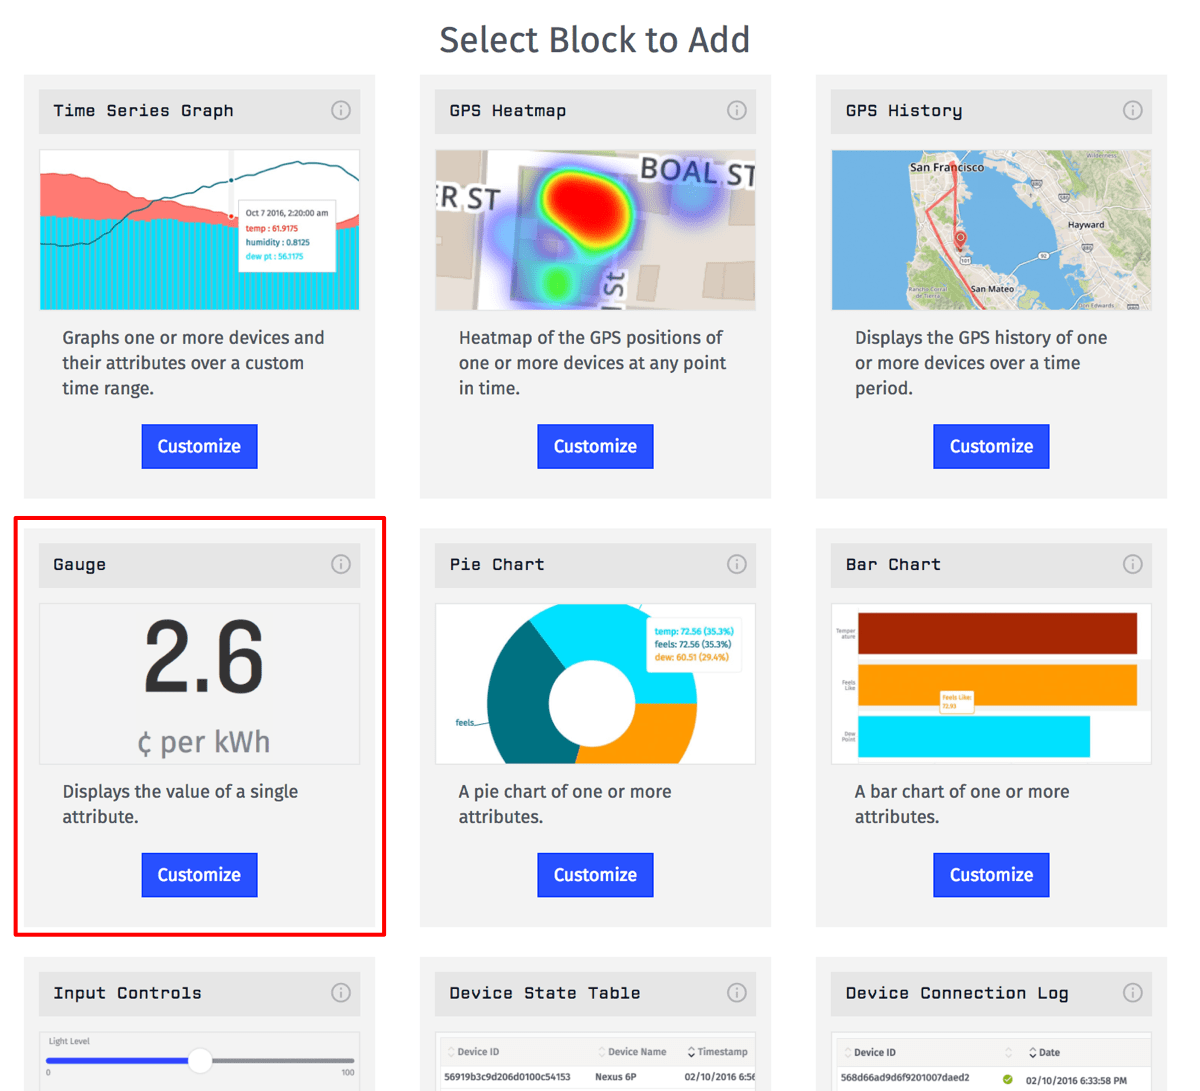
For each block, you can configure what device state data to display within the block.
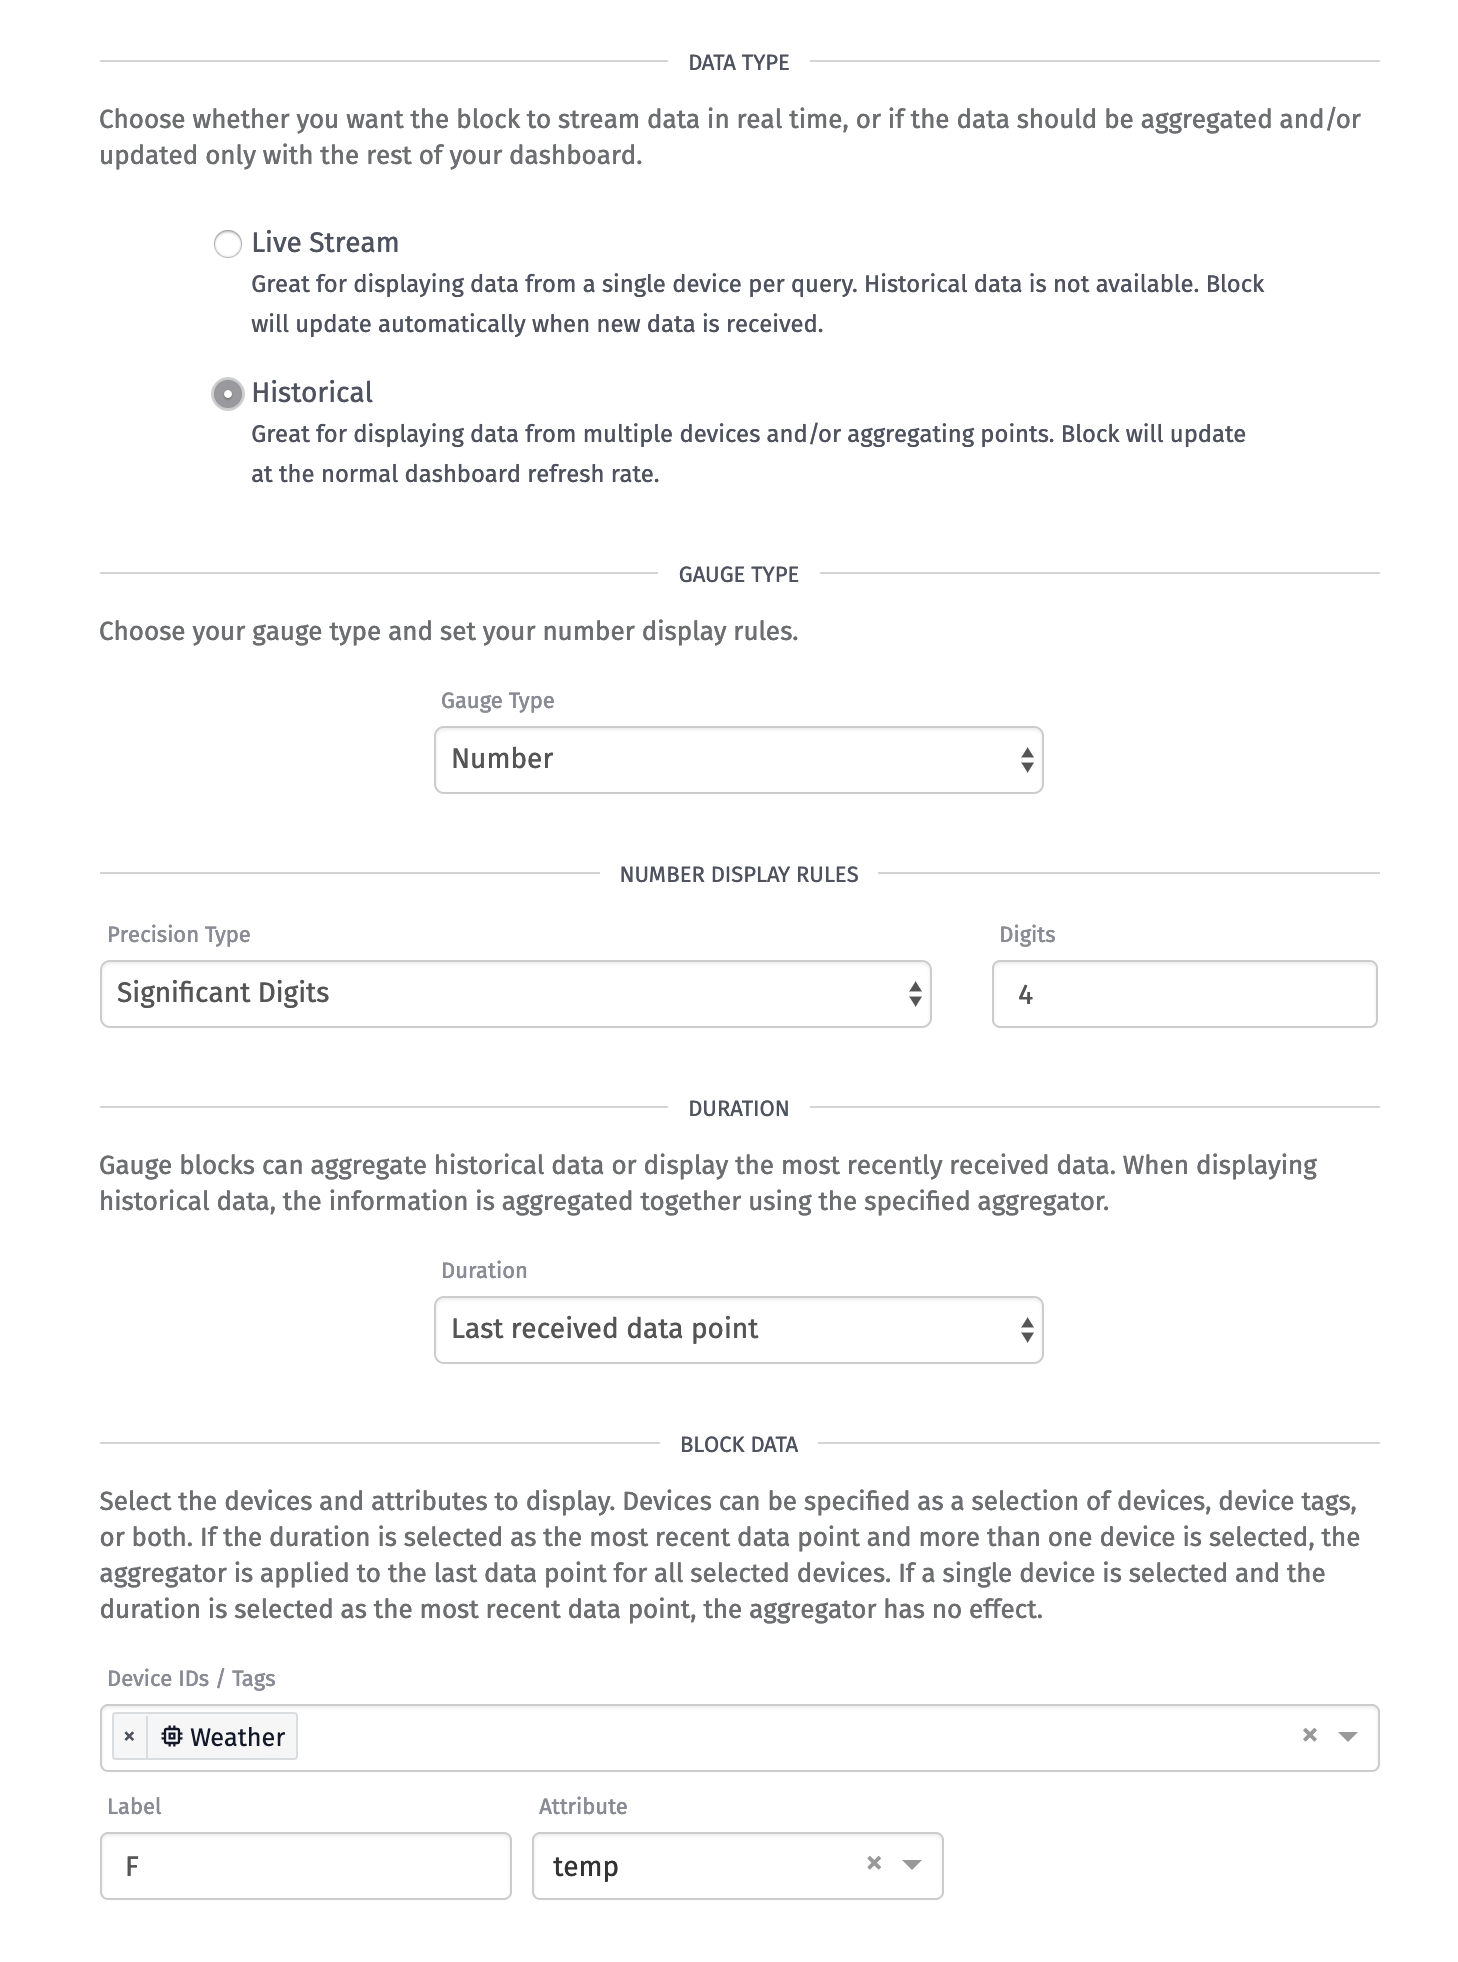
To configure this block, perform the following steps:
- Set the block title to
Temperature. - Select
Number Gaugeas the "Gauge Type." The Gauge has two ways to display itself. One is a simple number, which is what you'll want for this, and the other is a dial. - Set the duration to
Last received data point. Gauges can also display aggregates over time. For example, you could display the average temperature over the last 24 hours. - For the block data, set the label to
˚C, which is an arbitrary string that will appear under the number. Typically this would be the units for the data being displayed. - Select the device you created earlier and set the attribute to
temp. The attributes correspond to the attributes we defined for our device and the attributes that the workflow is currently populating with weather data.
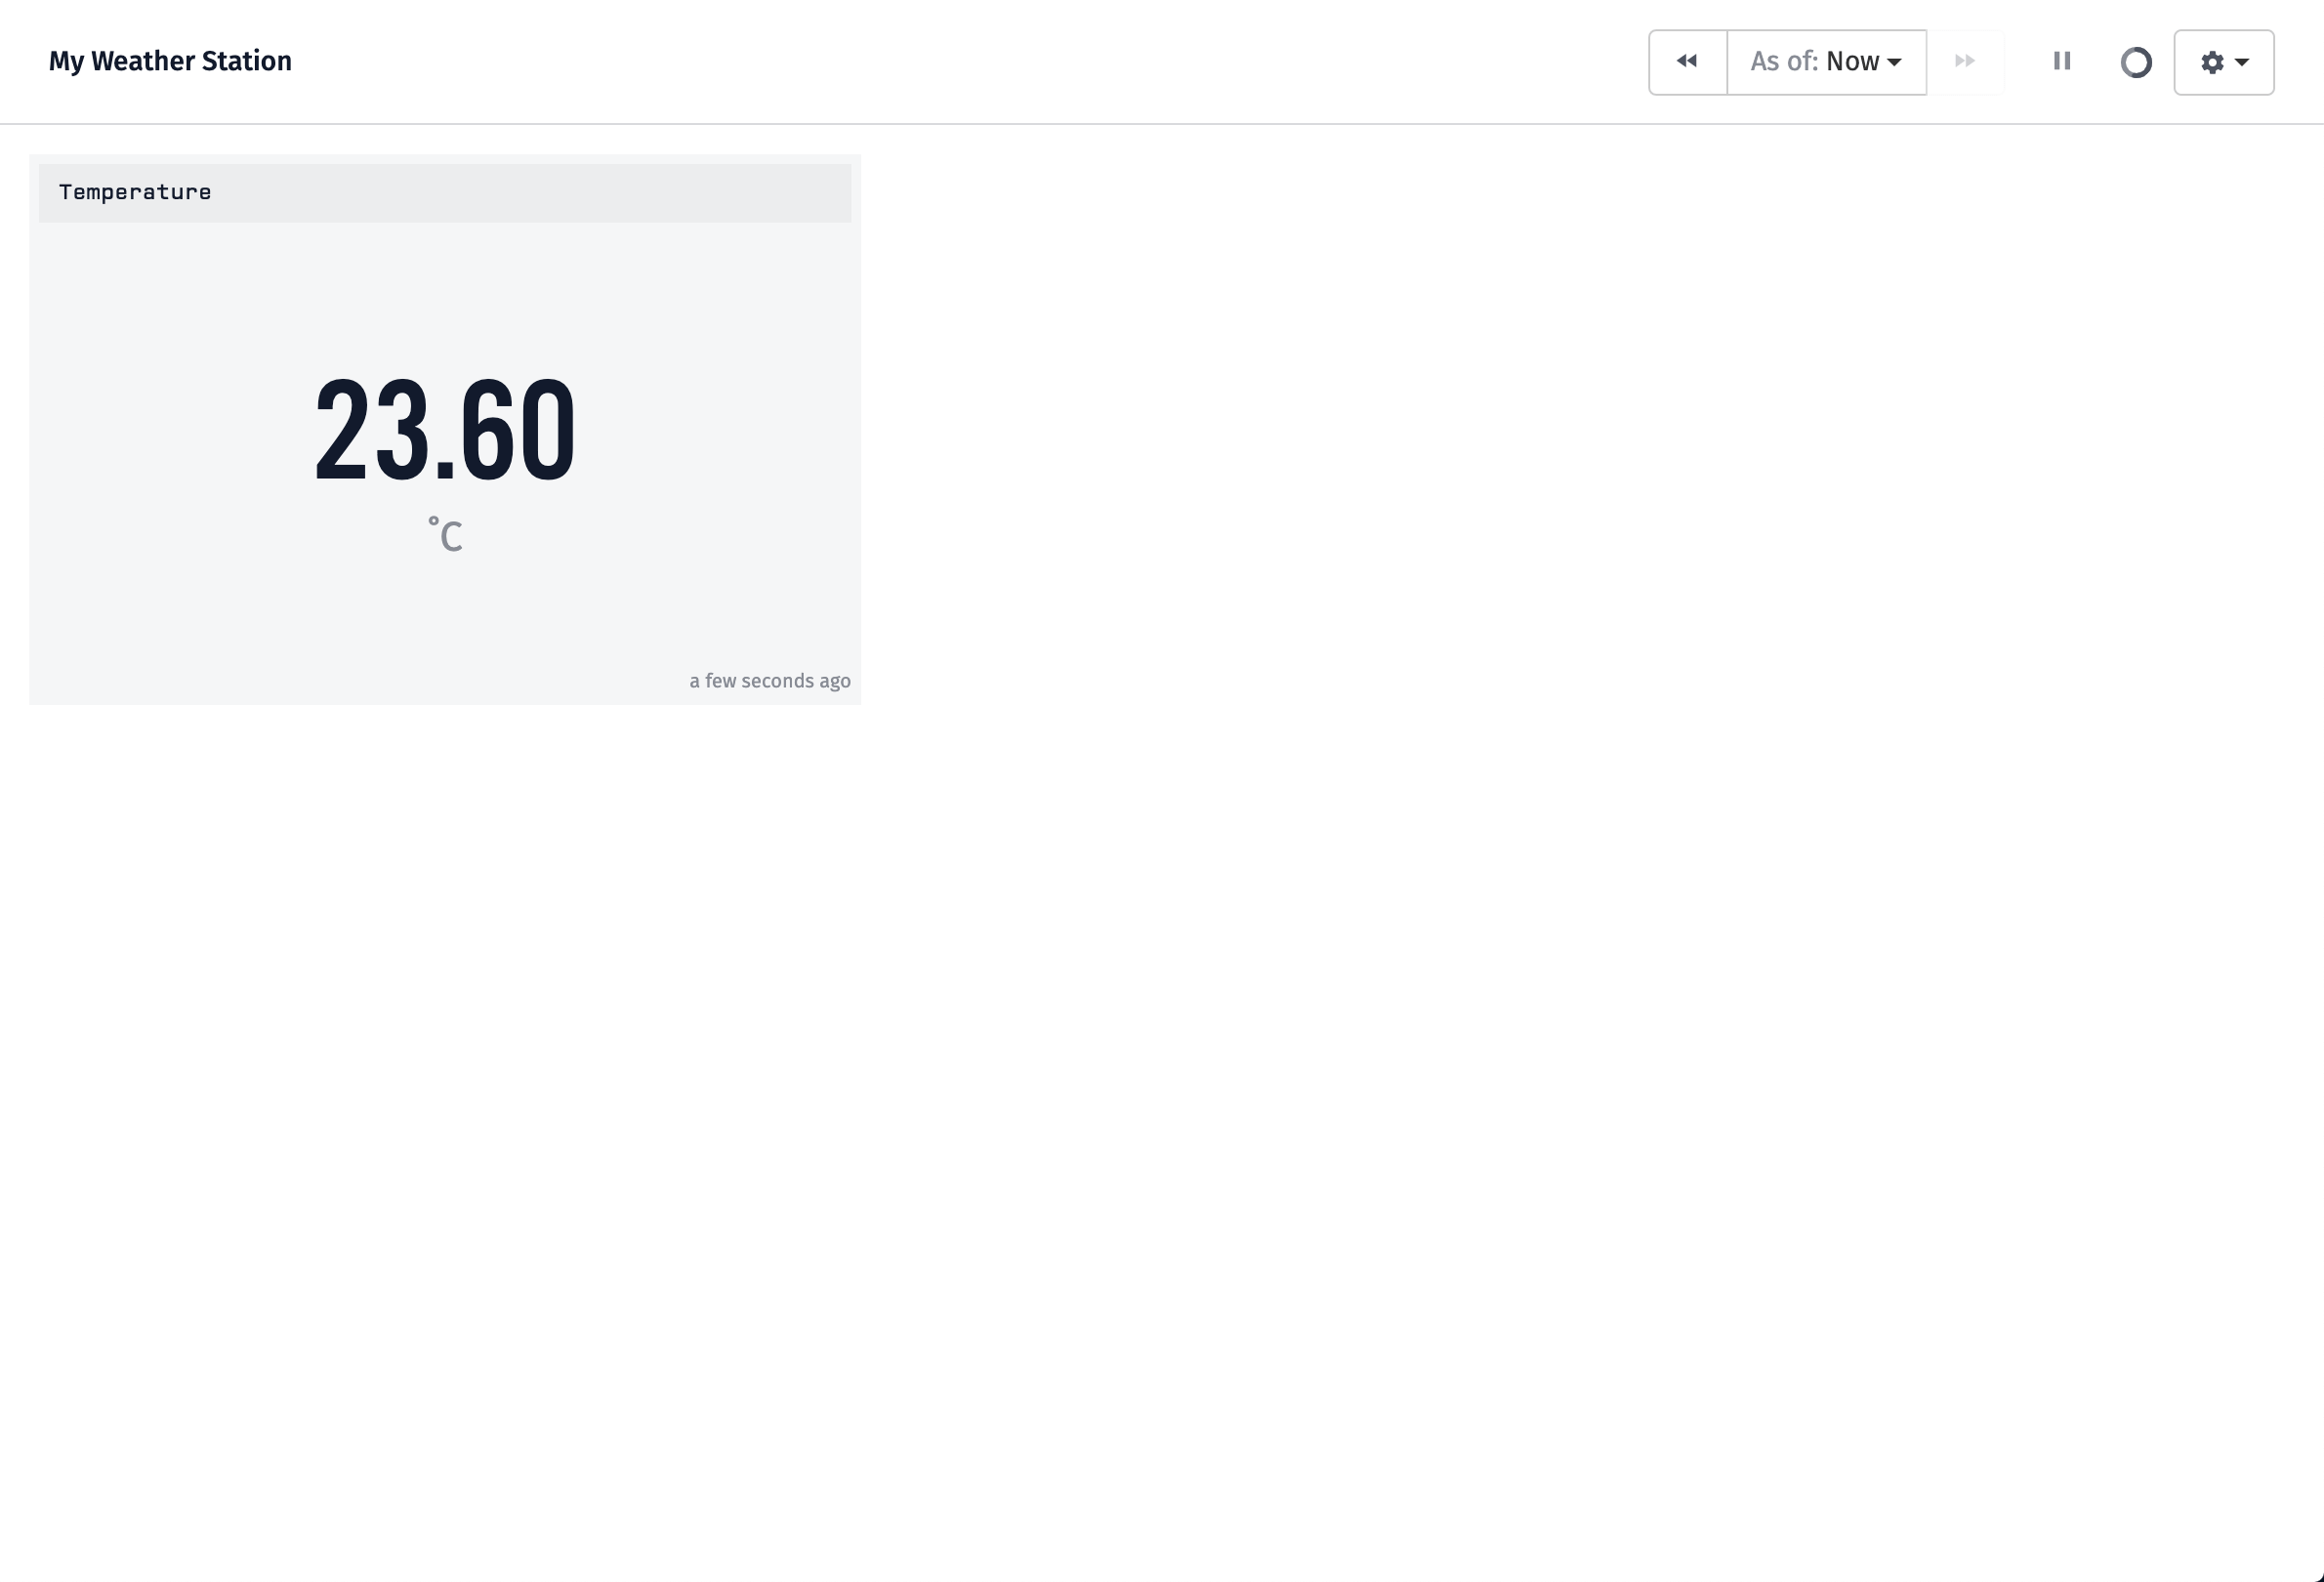
Overall, we are configuring this block to query the most recently received value for the temp attribute from the device and displays it on the dashboard.
Click Add Block to view it on your new dashboard.
Display Humidity
Next, let's add another Gauge to show the humidity. Add a new gauge block using the Add Block button at the top of the dashboard.
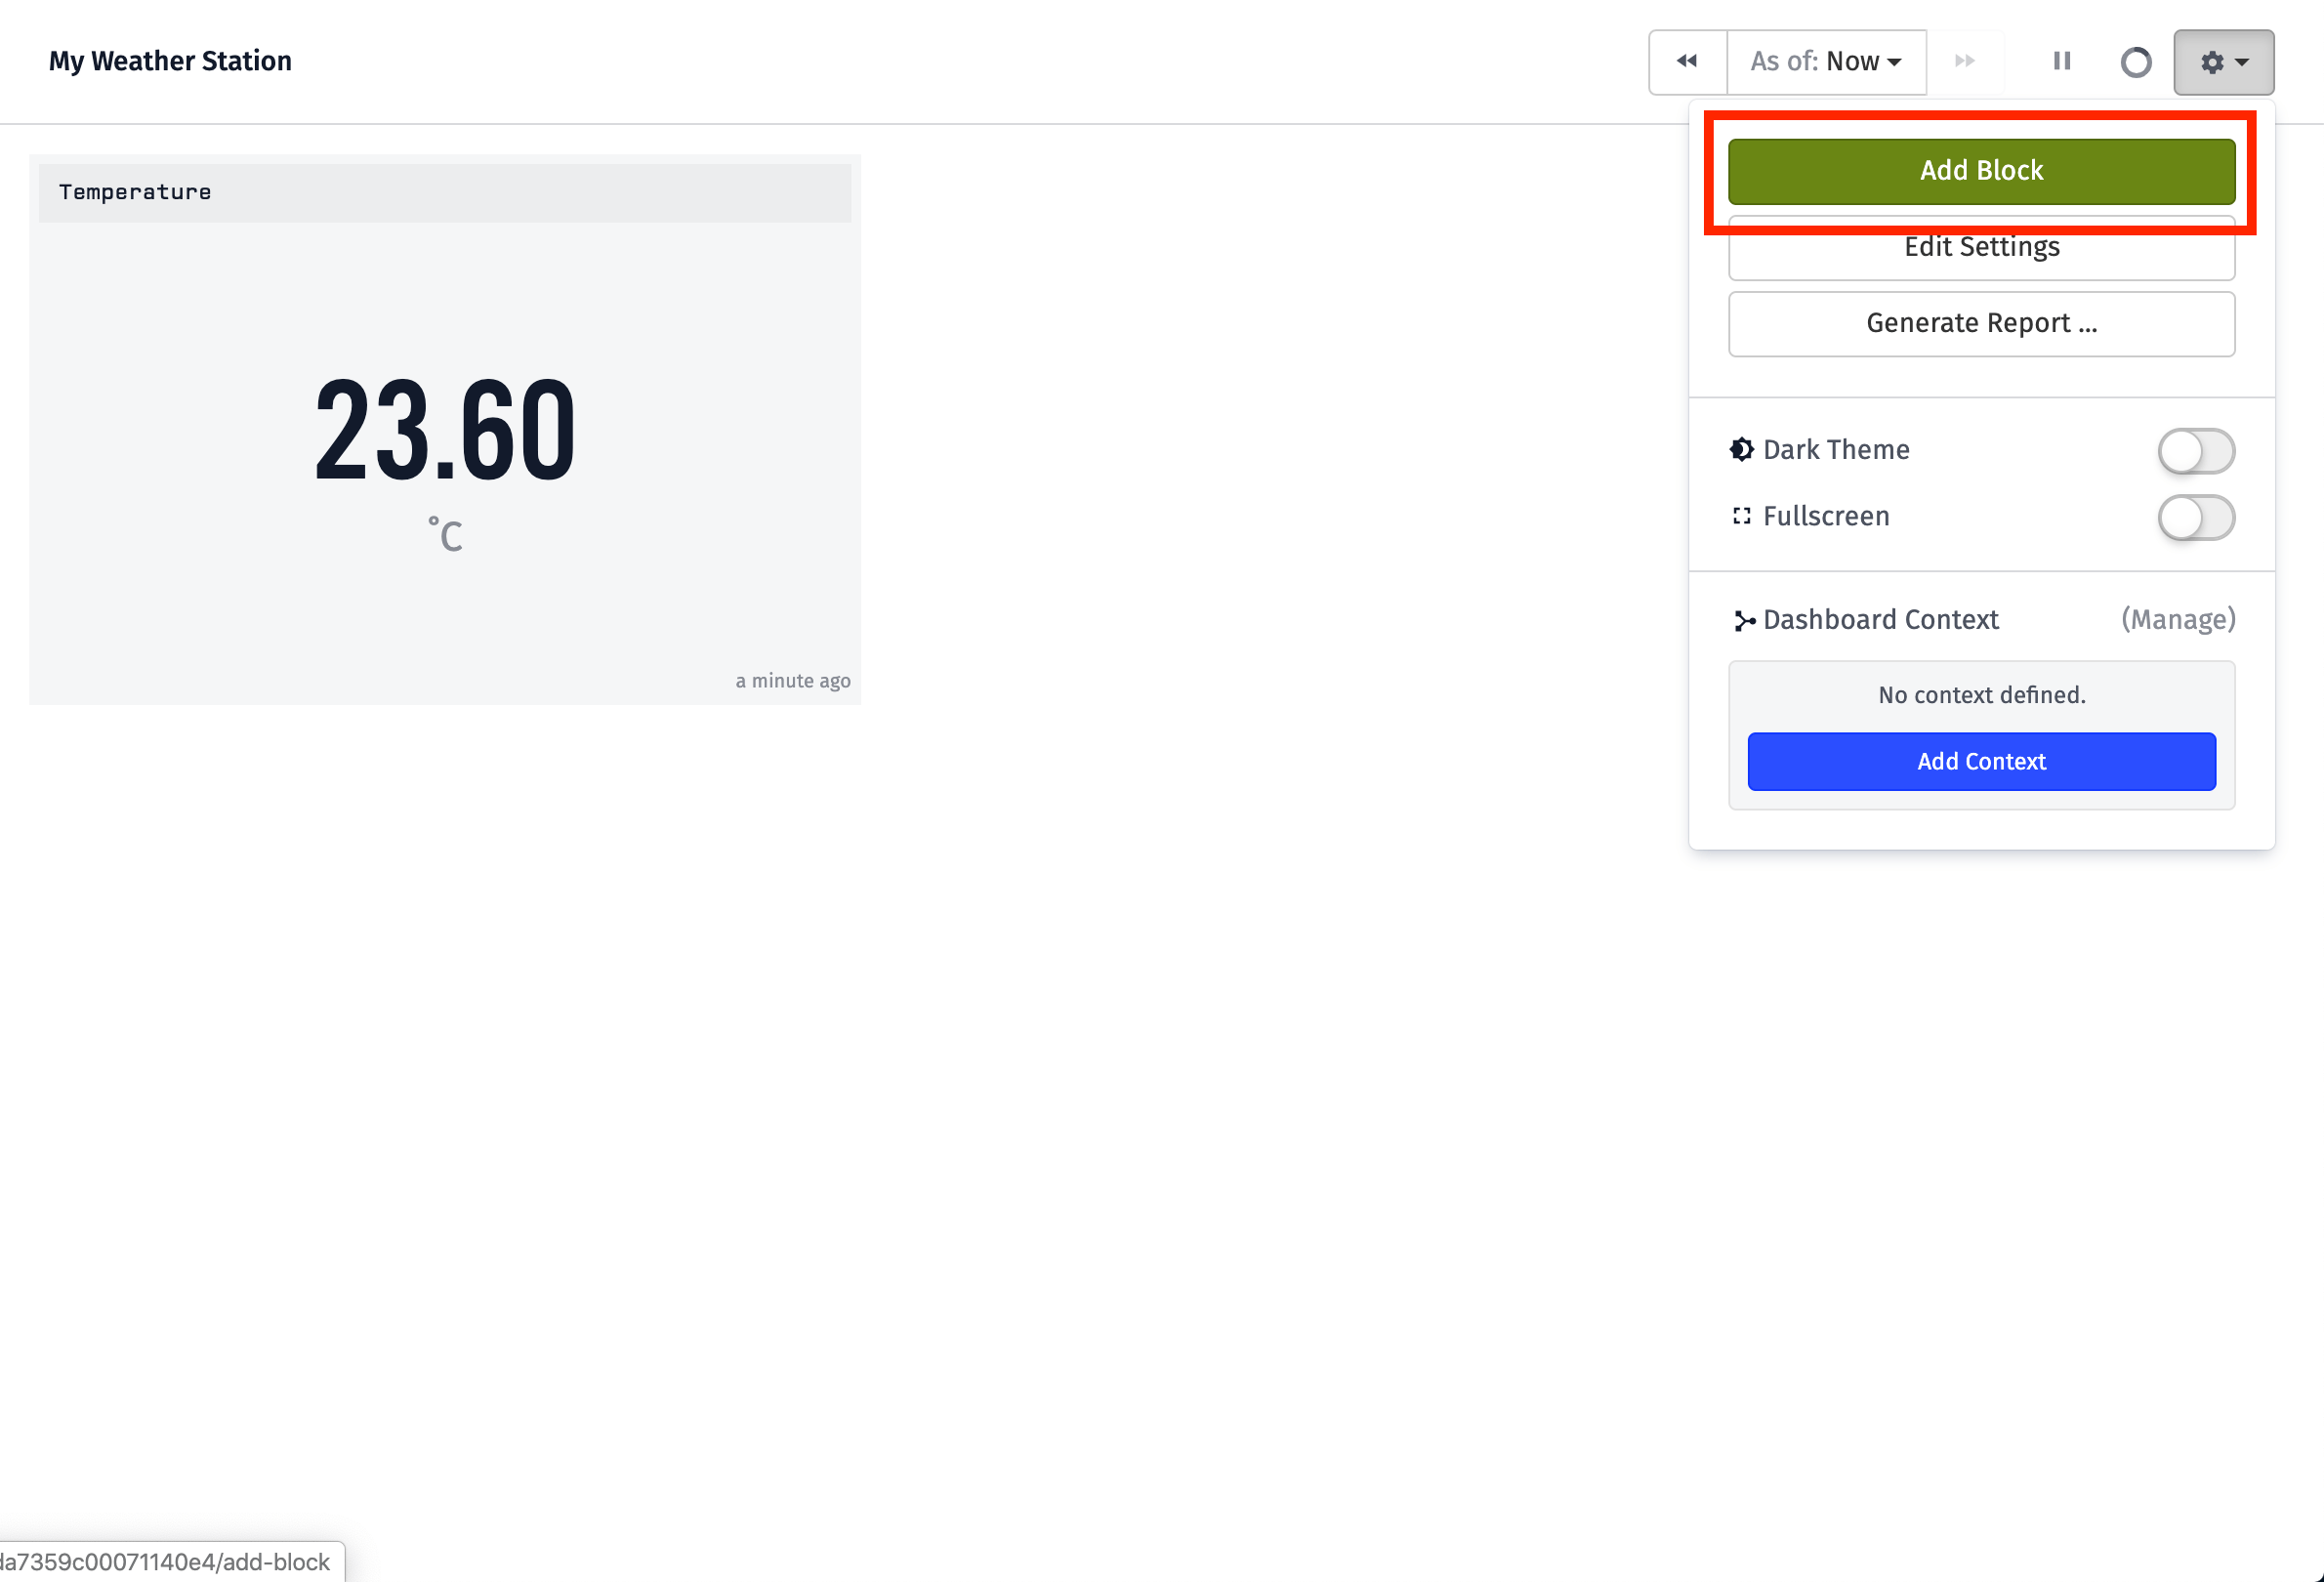
The steps are very similar to the previous. But, this time we are going to create a Dial gauge type instead of Number.
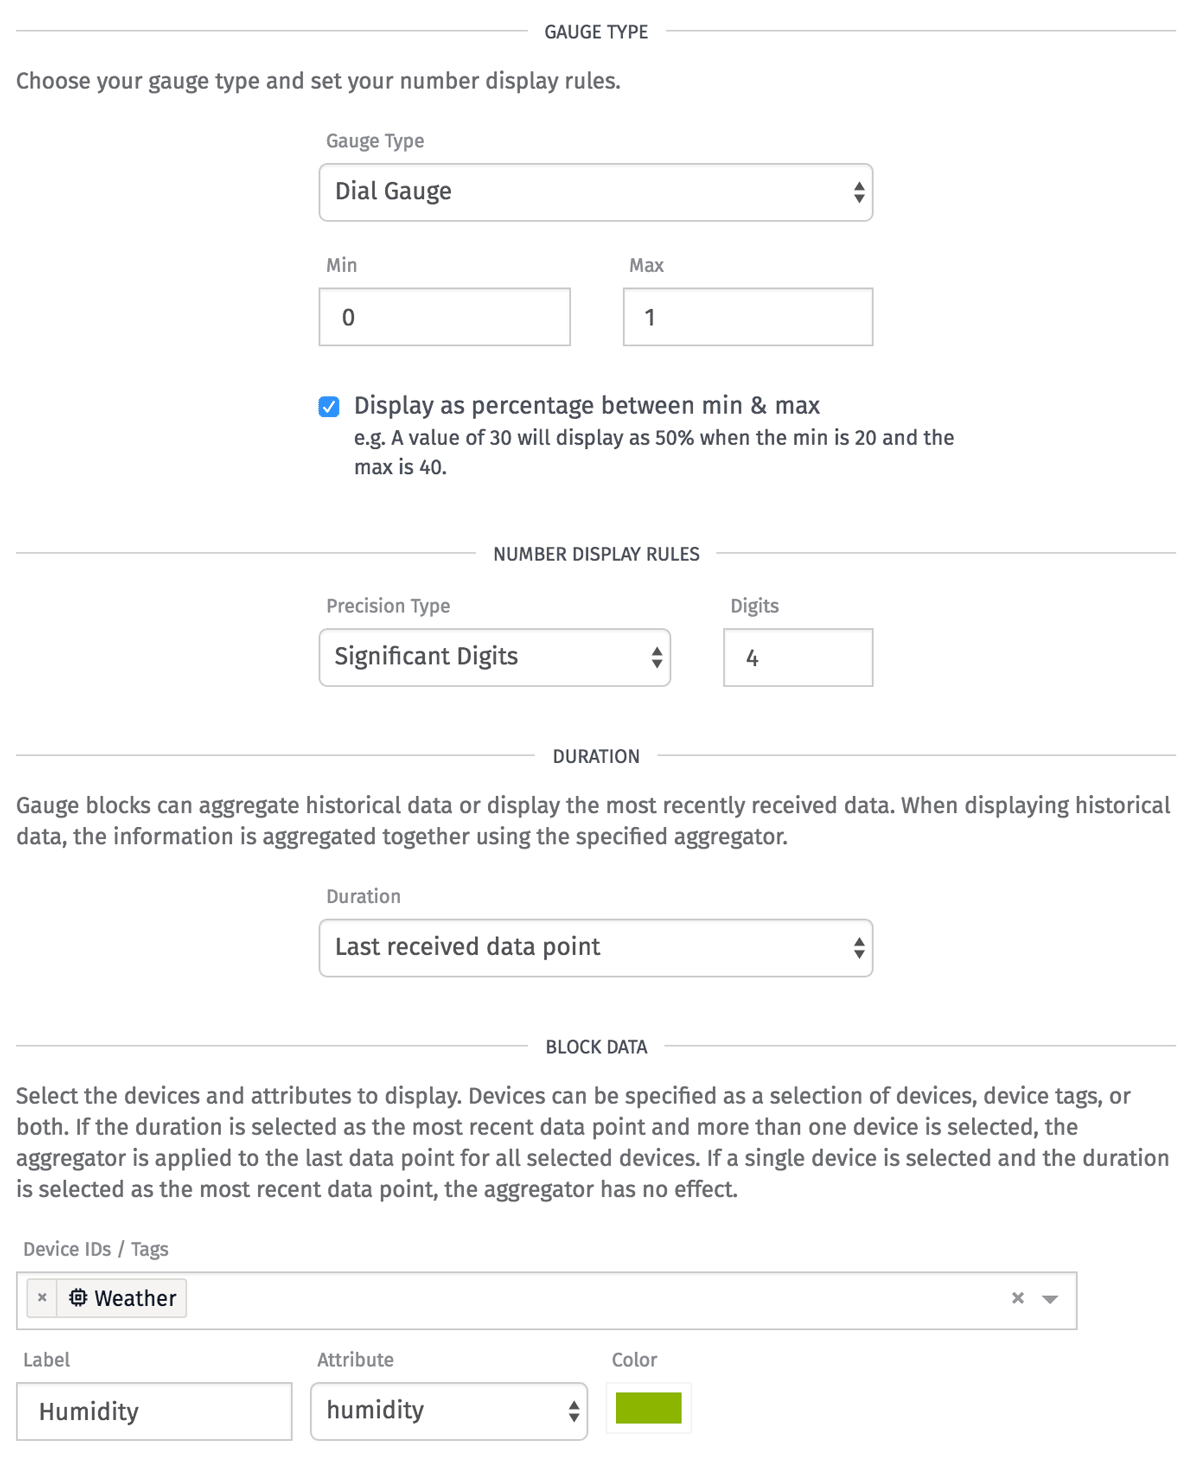
To configure this block, perform the following steps:
- Set the block title to
Humidity. - Select
Dialas the "Gauge Type". - Set the "Min" and "Max" to
0and100respectfully. Humidity is returned from OpenWeather as a percentage between 0 and 100 - Check "Display as Percentage" since humidity is a percentage.
- Set the duration to
Last received data point. - Select the device you created earlier and set the attribute to
humidity.
After you add the block, your dashboard will look like this:
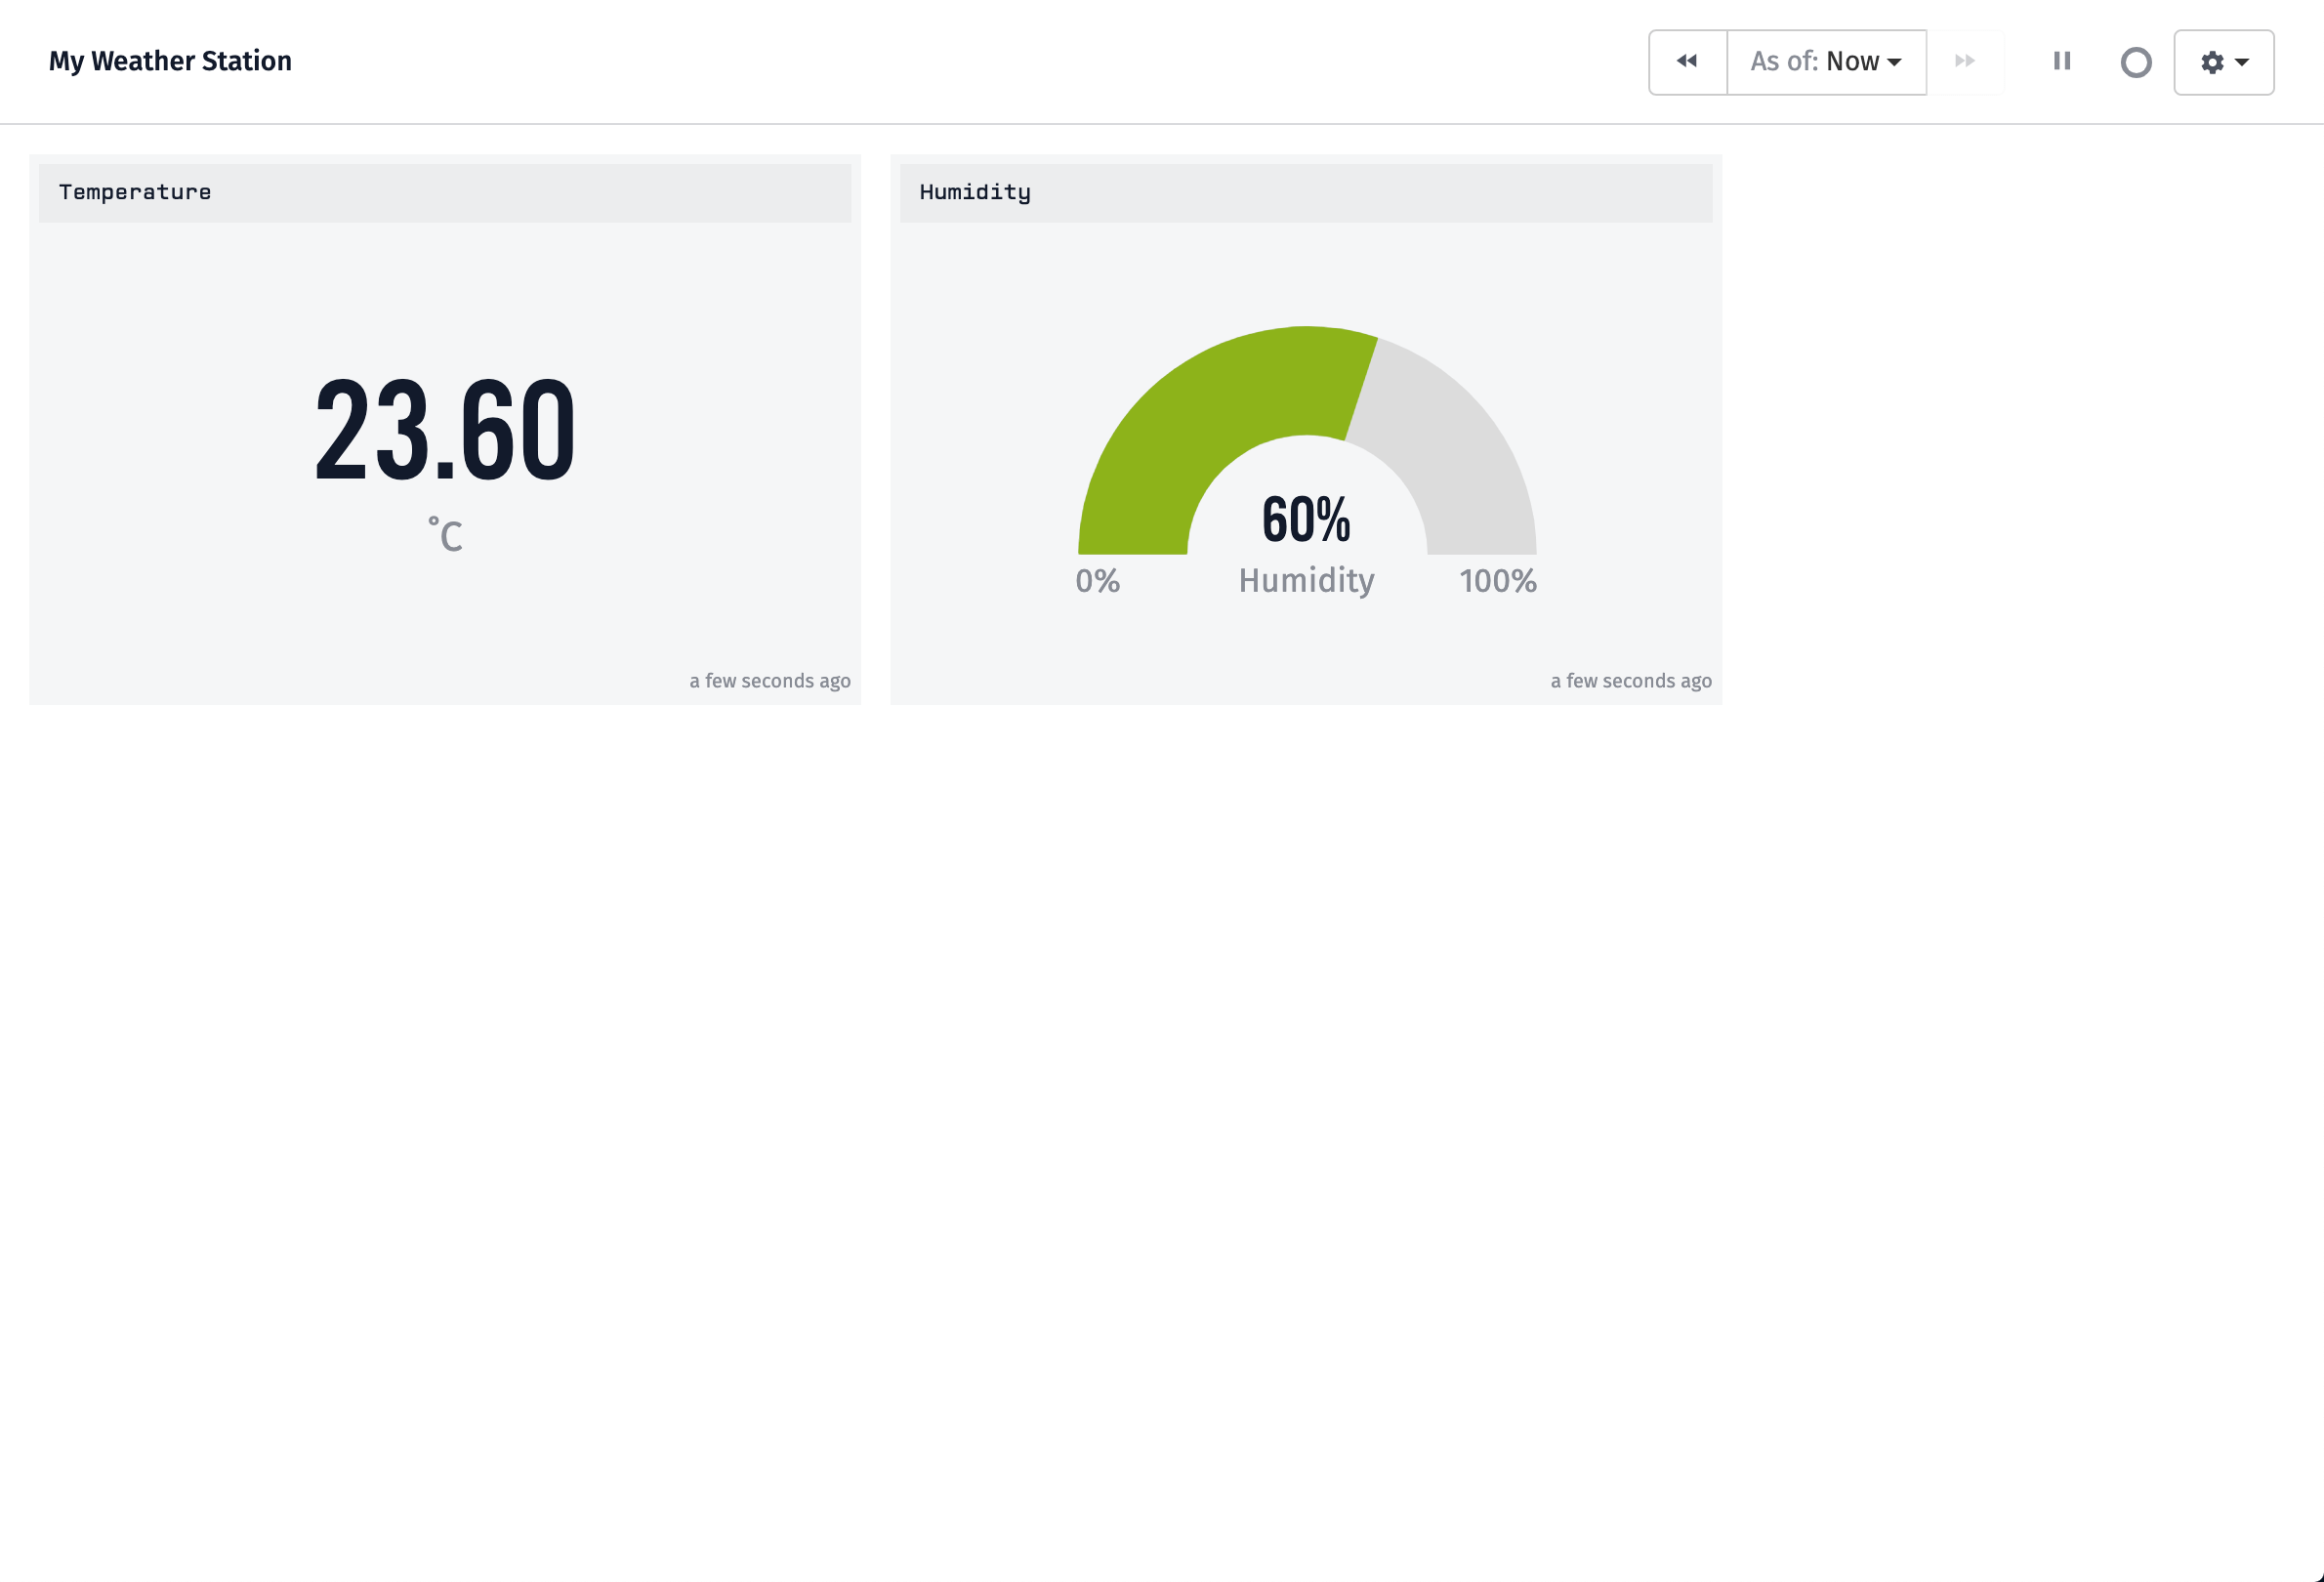
Now let's make some space for a graph to show how data is changes over time. Drag the humidity gauge underneath the temperature gauge.
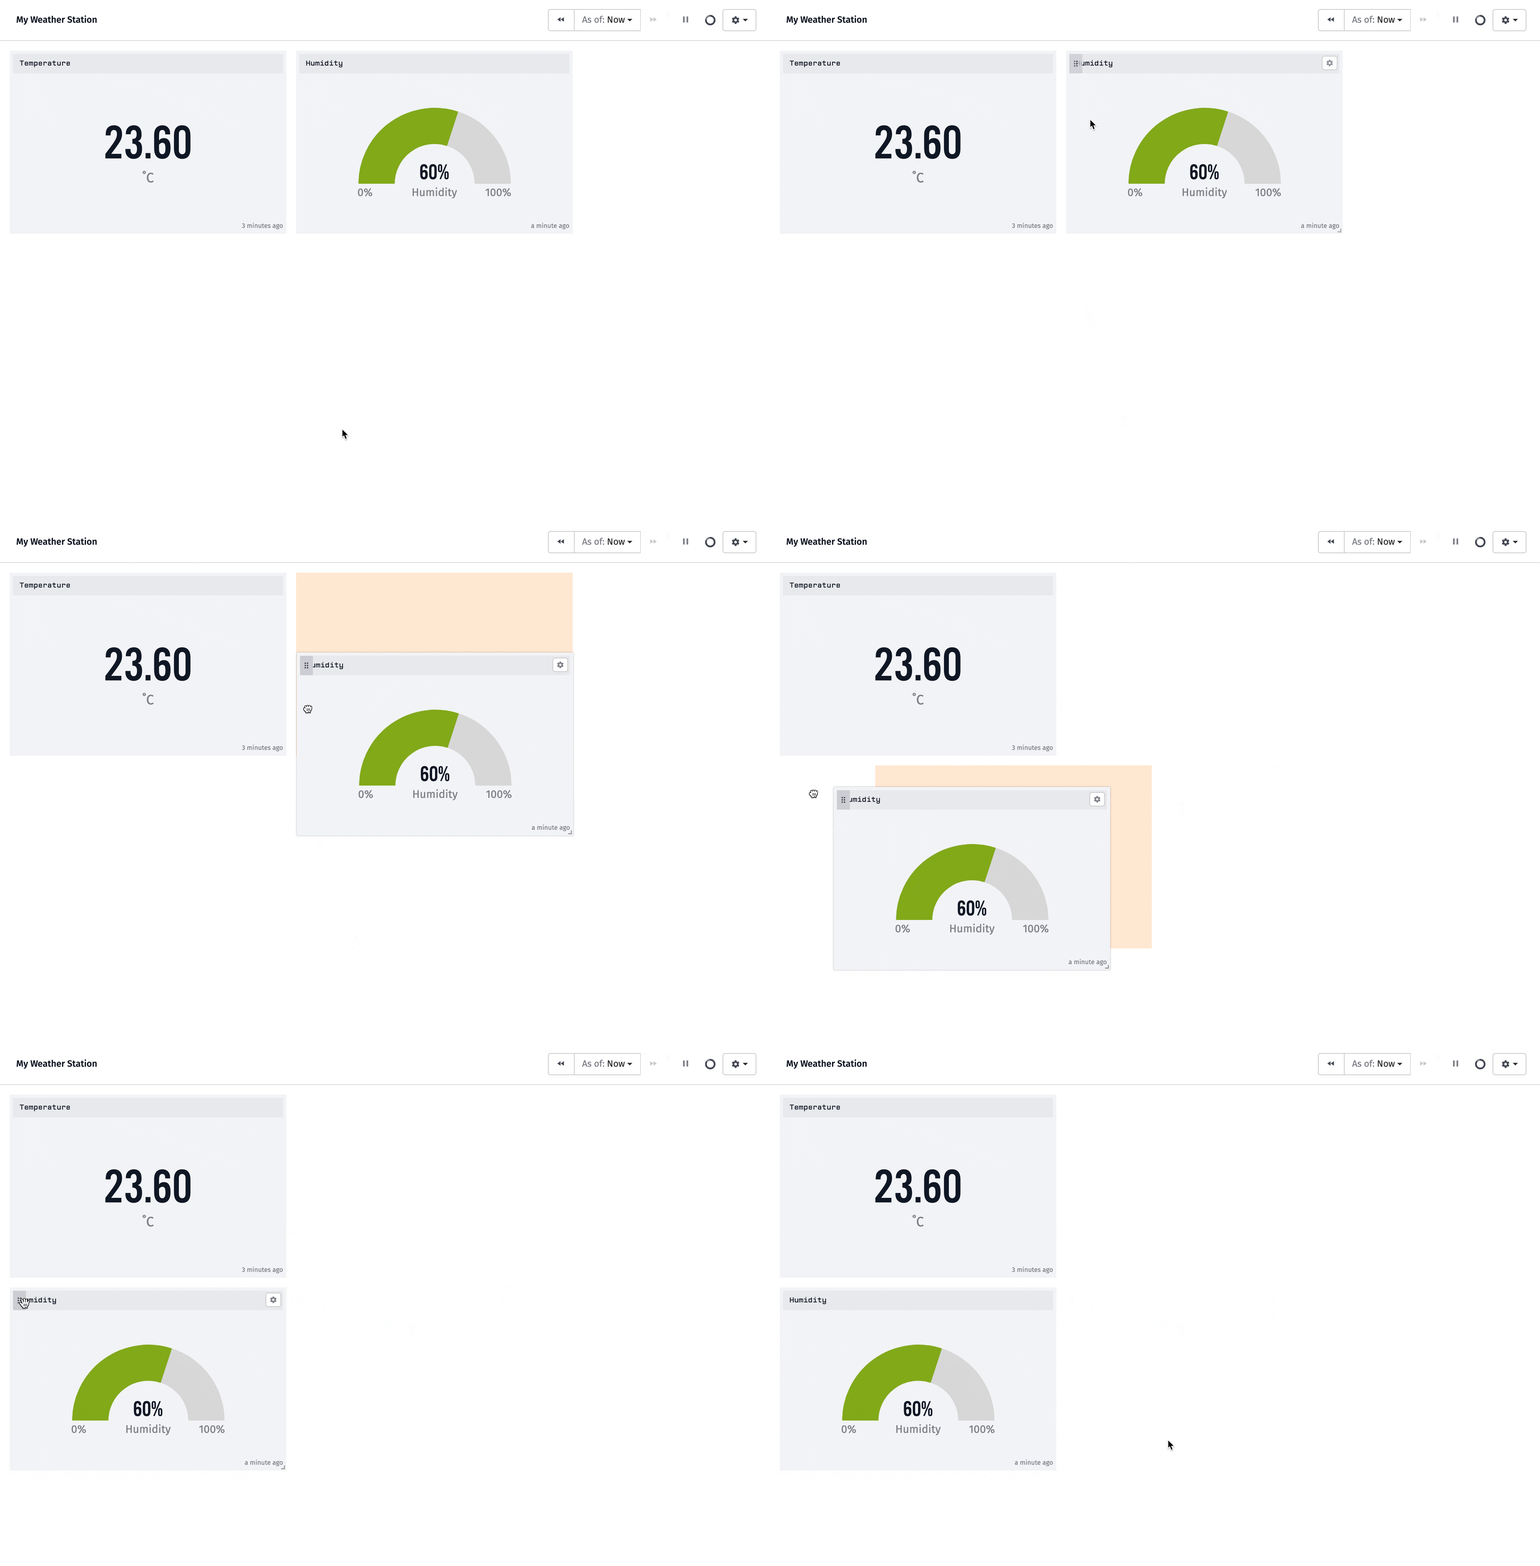
Display Values Over Time
Next, let's add a graph that displays temperature vs. humidity over time. We can do this using the Time Series Block.
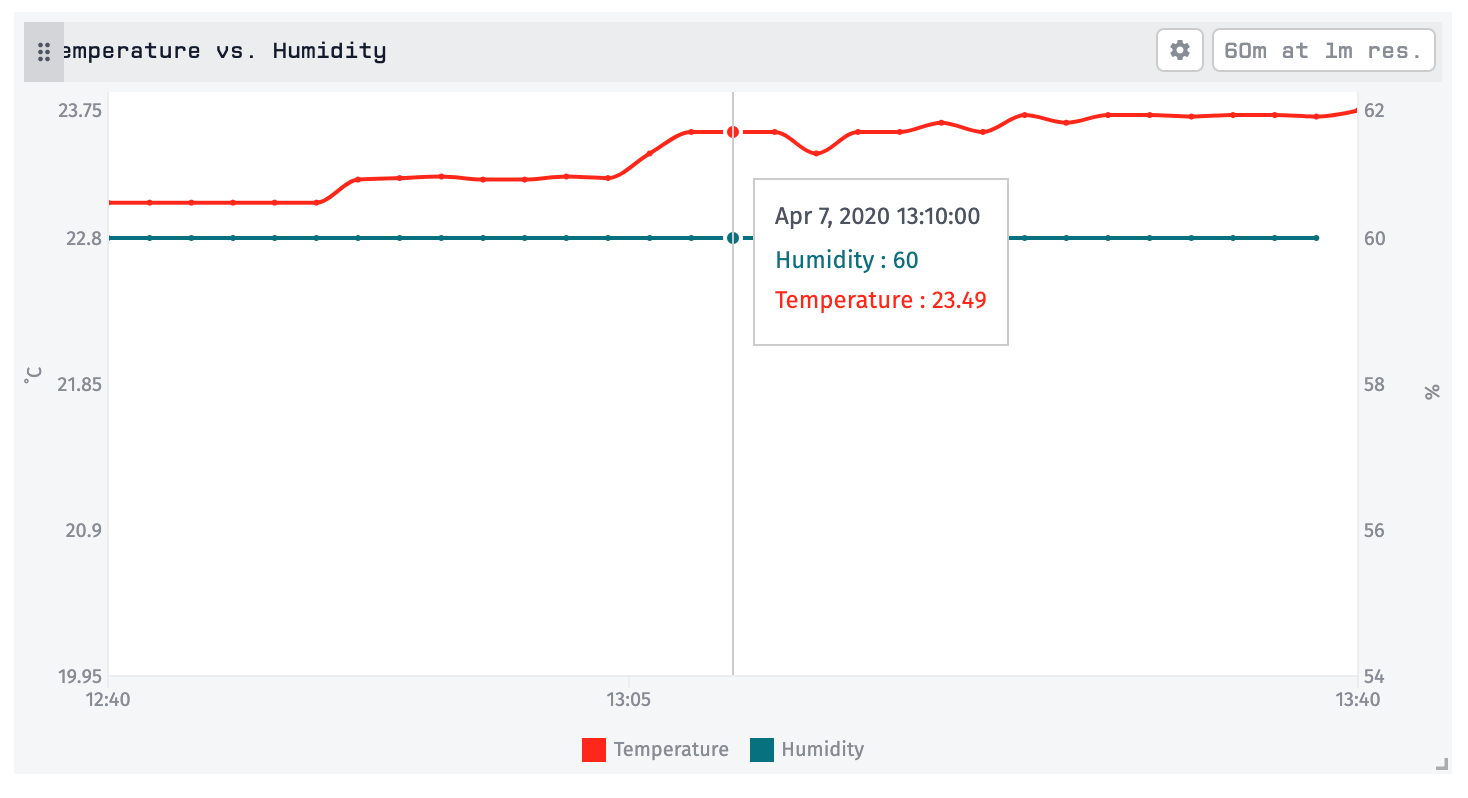
Click the "Add Block" button and add a Time Series Block.
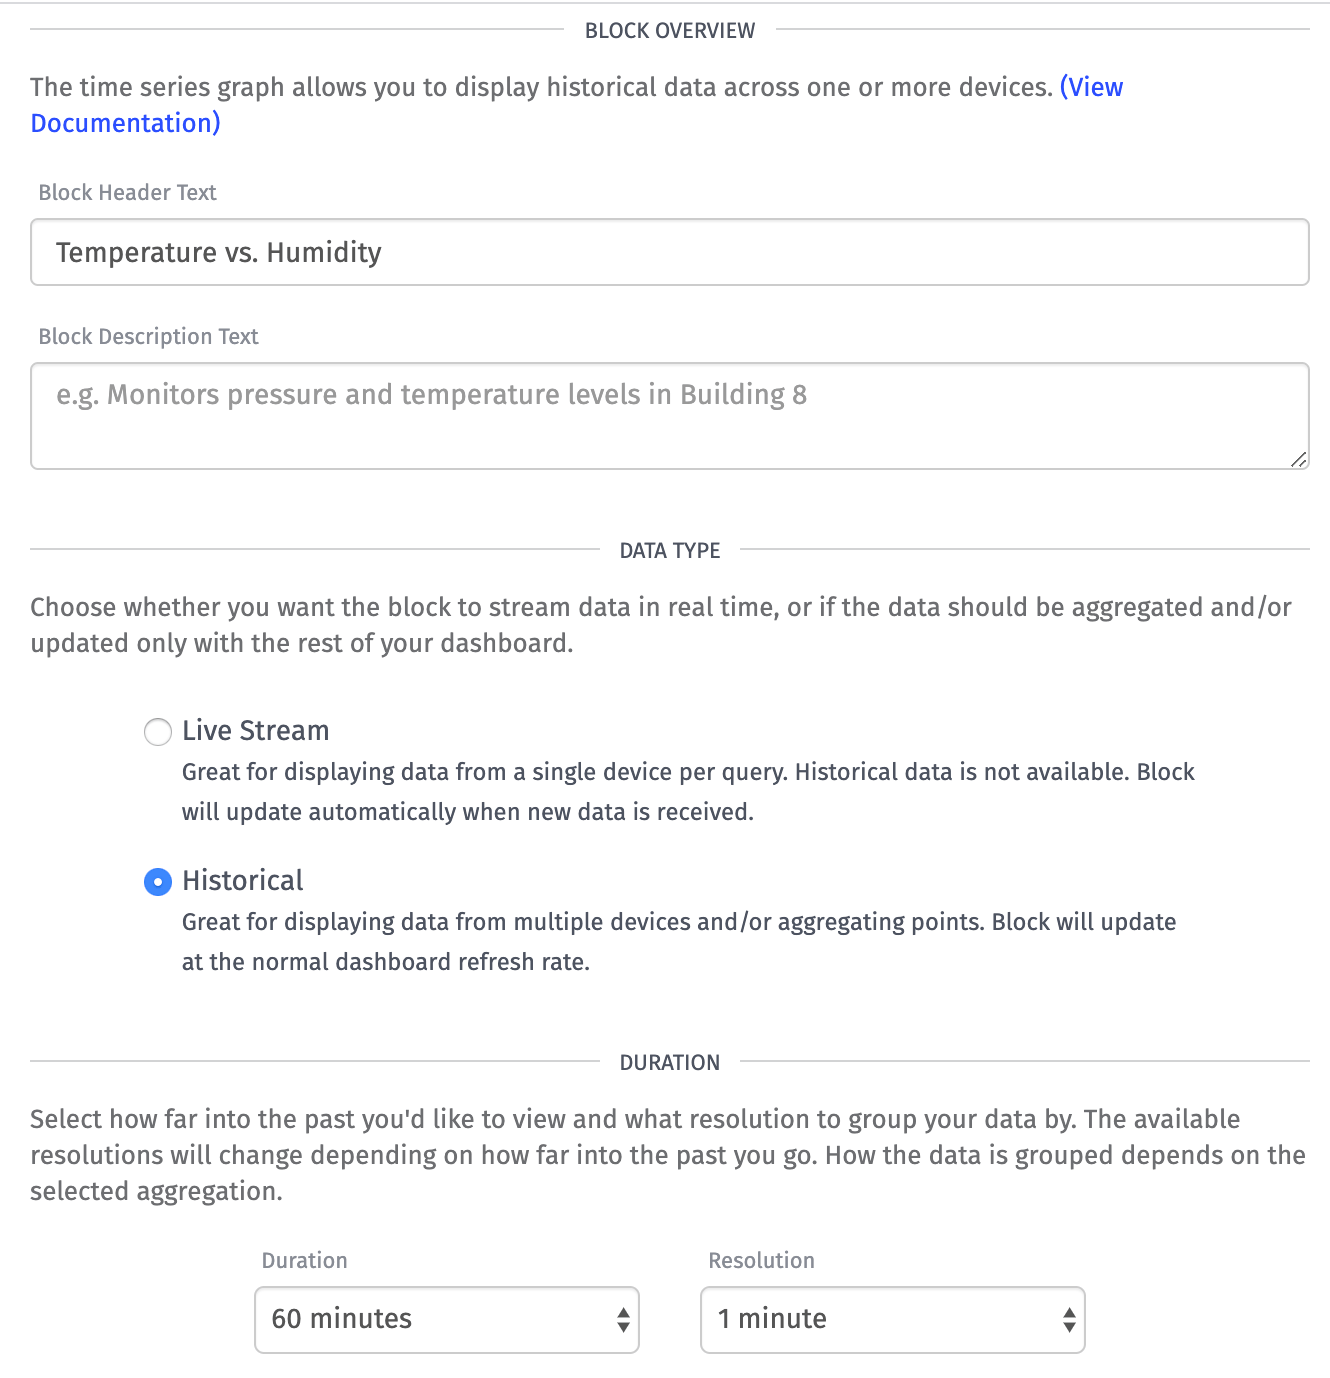
To configure this block, perform the following steps:
- Set the block title to
Temperature vs. Humidity. - Select
Historicalas the "Data Type". - Select
60 Minutesas the "Duration" and1 minuteas the "Resolution." - Set the "Min" and "Max" to
0and100respectfully. Humidity is returned from OpenWeather as a percentage between 0 and 100 - Check "Display as Percentage" since humidity is a percentage.
- Set the duration to
Last received data point. - Select the device you created earlier and set the attribute to
humidity.
The Time Series Graph requires you to select a duration and a resolution. The duration is how far back in time you'd like to view. Since you don't have much data yet, select 60 minutes. As your device continues to collect weather data, you can increase this to view longer time periods if needed.
The resolution is how far apart individual data points are. Select one minute for this example, which means you'll see a data point for every minute.
Temperature Segment
Unlike the Gauge, which can only display a single value, Time Series Graphs can display multiple series. In this example we want to display two: one for the temperature and one for the humidity. Let's configure our first segment.
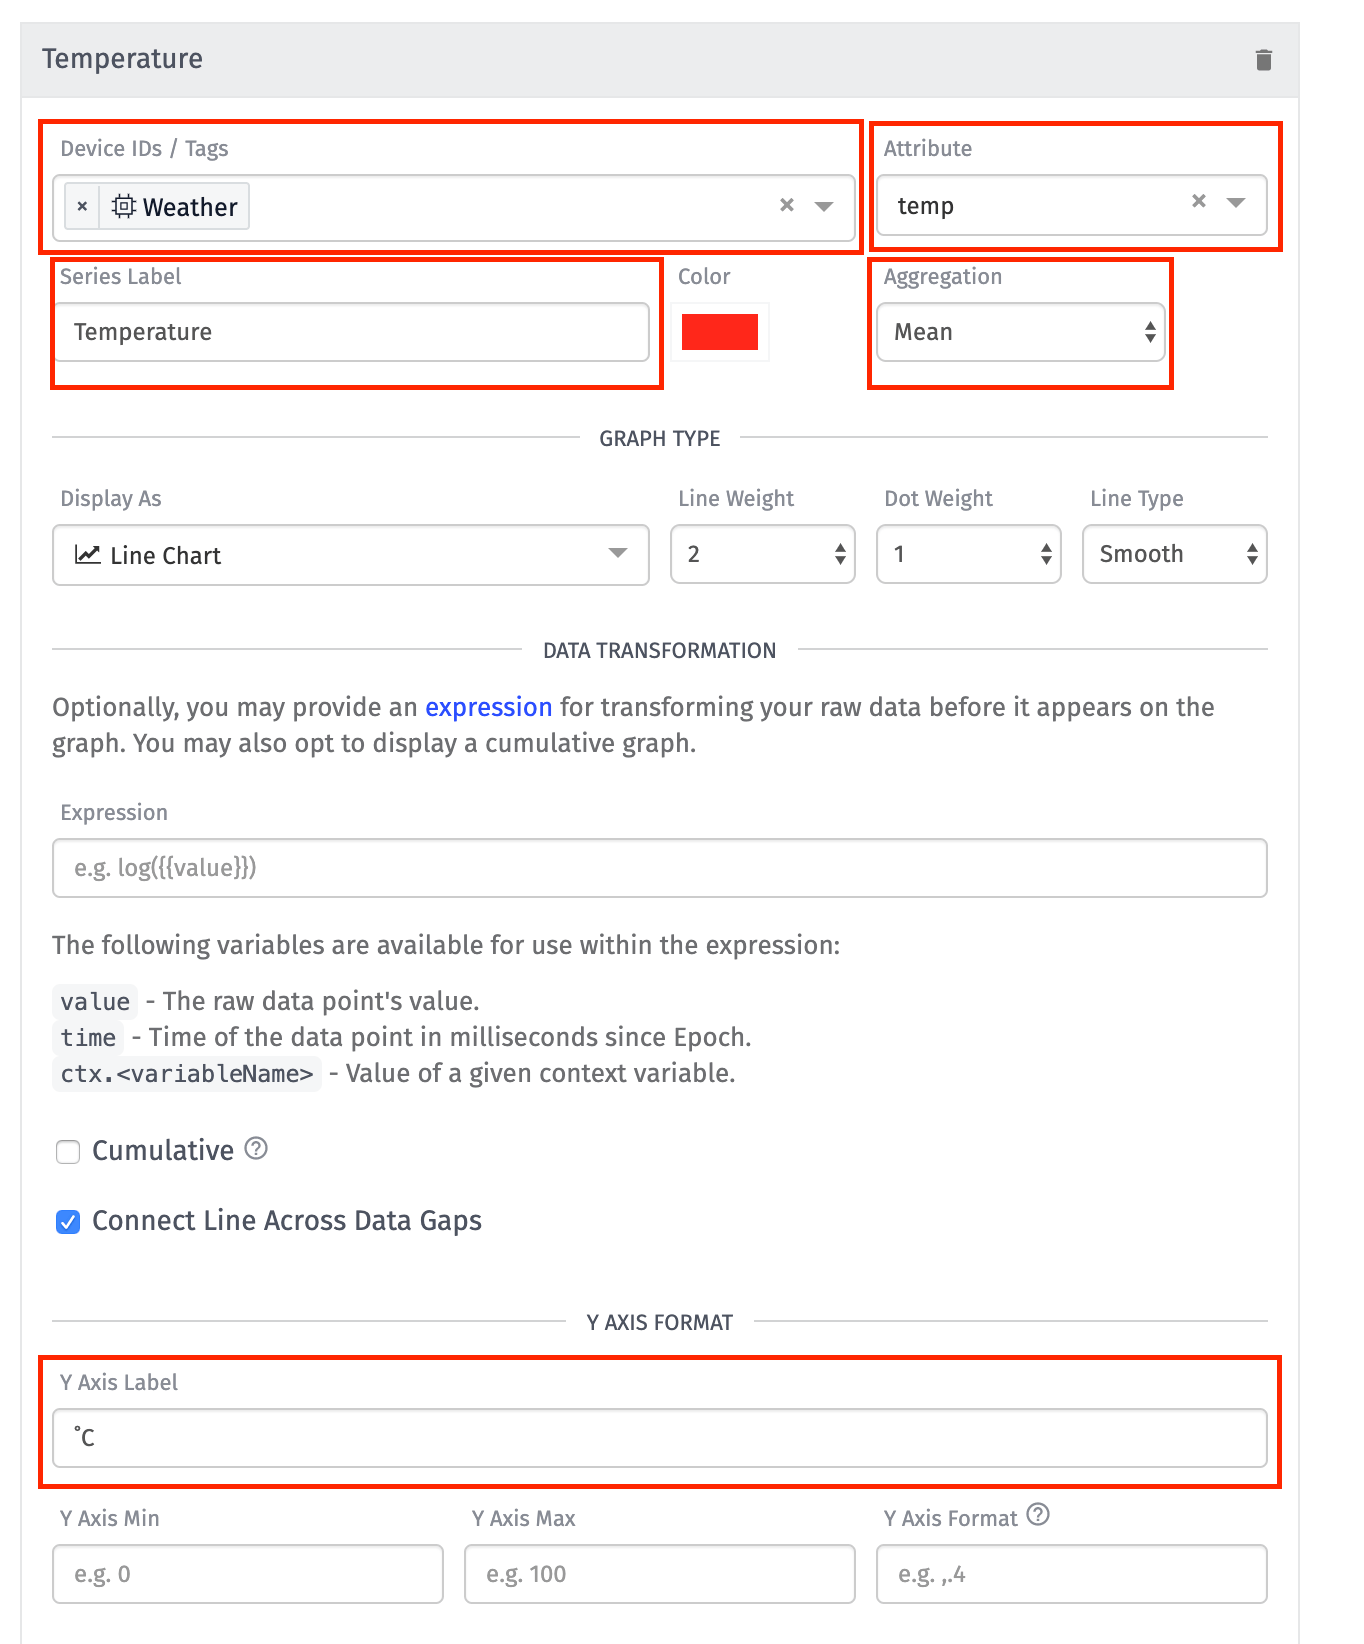
To configure this block, perform the following steps:
- Set the block title to
Temperature vs. Humidity. - Select
Historicalas the "Data Type". - Select
60 Minutesas the "Duration" and1 minuteas the "Resolution". - Set the "Min" and "Max" to
0and100respectfully. Humidity is returned from OpenWeather as a percentage between 0 and 100 - Check "Display as Percentage" since humidity is a percentage.
- Set the duration to
Last received data point. - Select the device you created earlier and set the attribute to
humidity.
After configuring the first series to display temperature, like above, click the Add Segment button to add a second configuration block for humidity.
Once you're done, you should see a preview like this:

Next, click Add Block to add this new block to the dashboard. You now have a graph that displays temperature and humidity over the last 60 minutes.
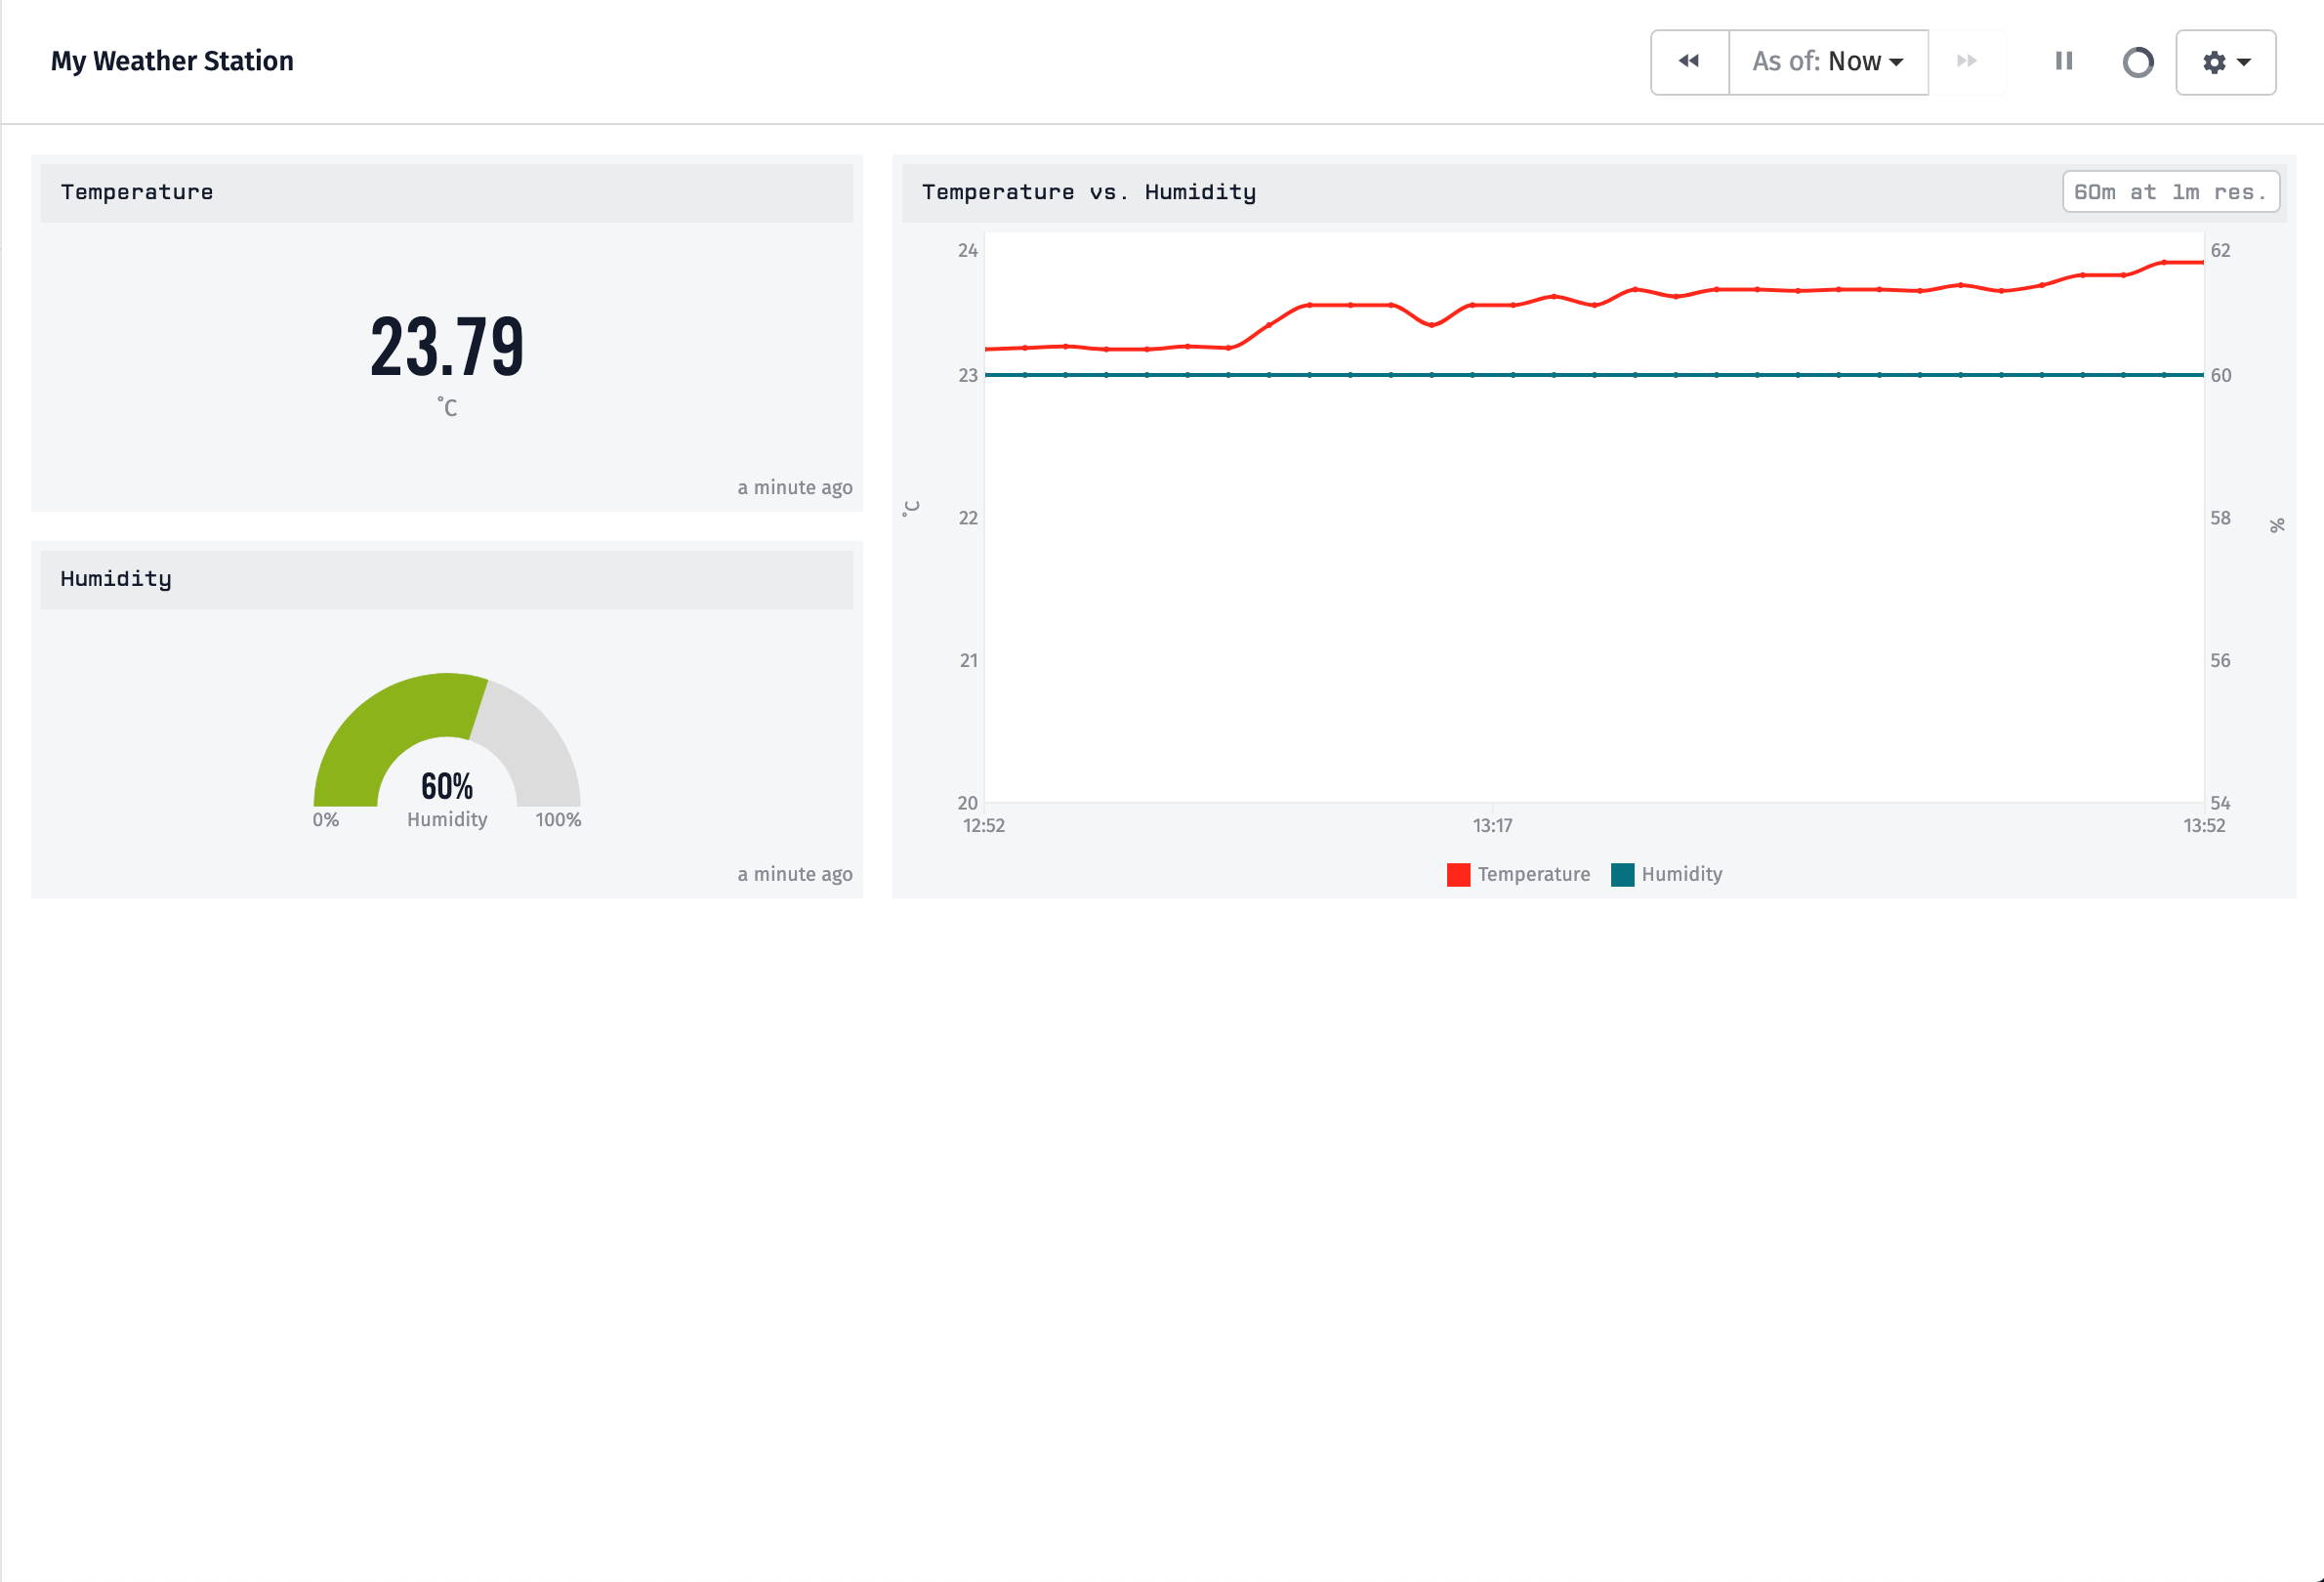
Congrats! You have now created an application that queries from the OpenWeather API, saves it to a device within WEGnology, and visualize the data on a dashboard.
What's Next?
Once complete, you now have a capable local weather dashboard for viewing the current and historical weather data.
Additional Challenges
The remainder of the dashboard is left as a challenge for you.

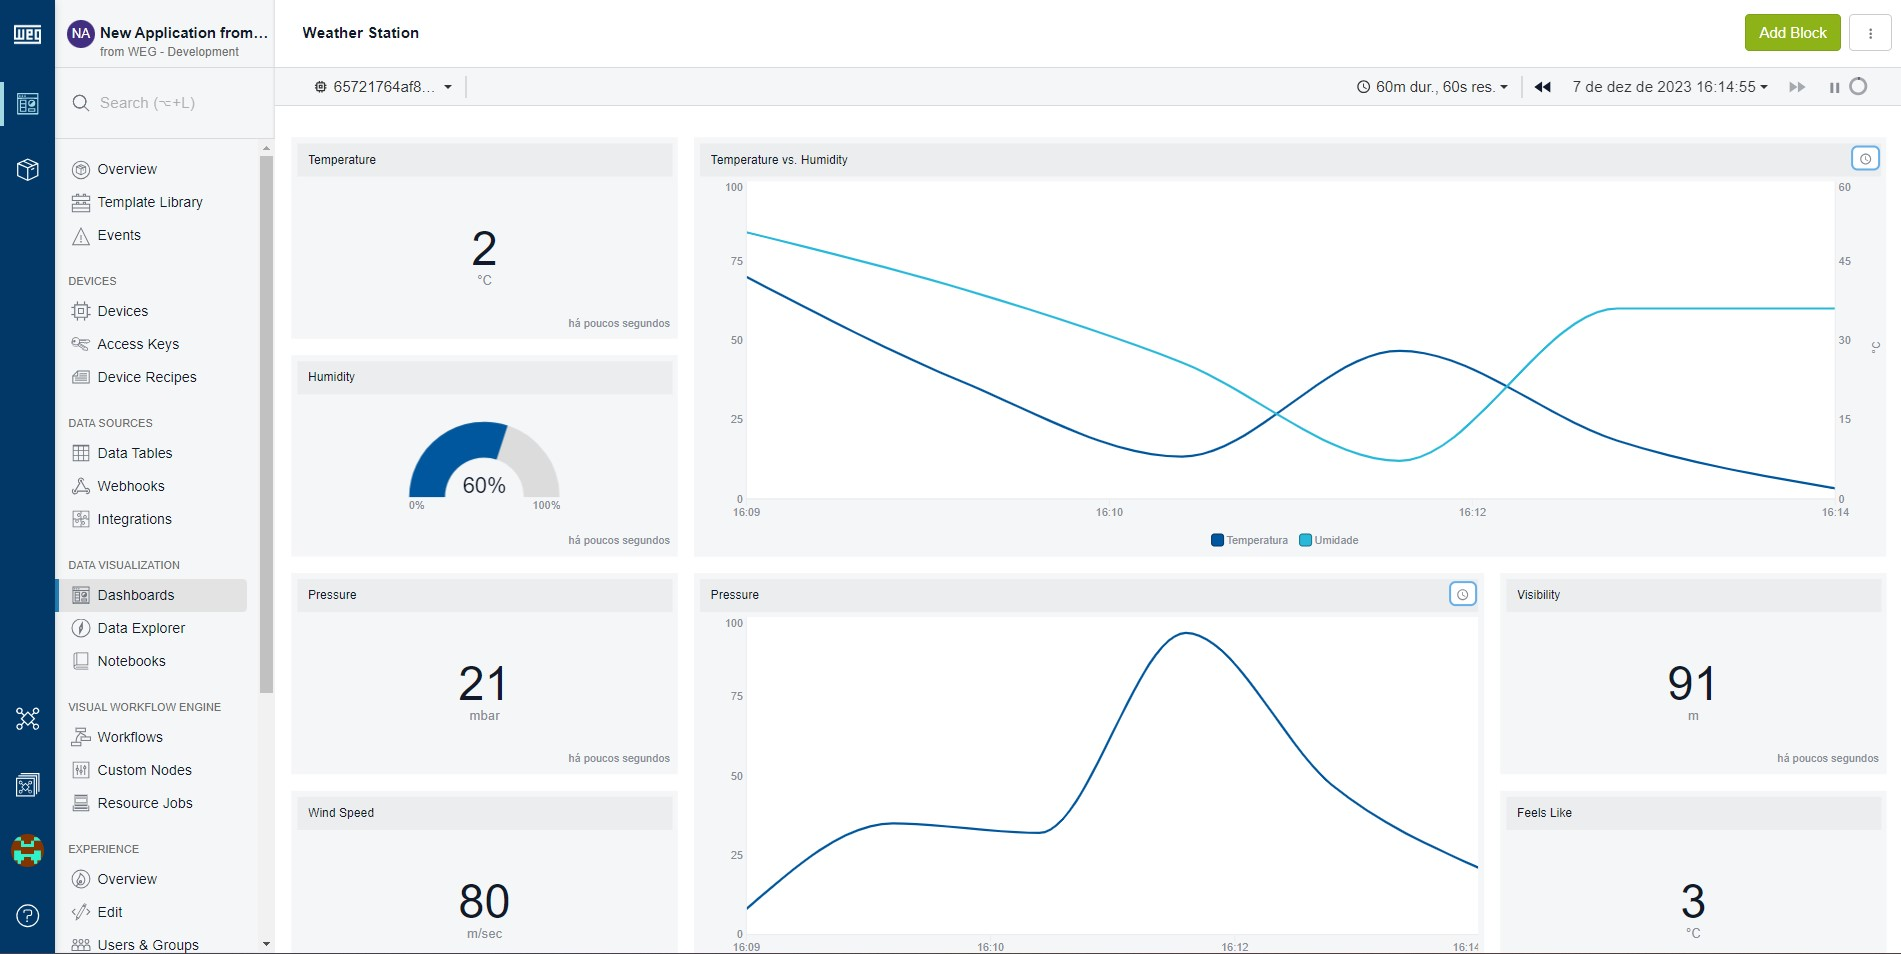
The above dashboard adds the following blocks:
- Pressure number gauge using the
pressureattribute. - Wind Speed number gauge using the
wind-speedattribute. - Pressure graph showing the
pressureattribute over the last 60 minutes. - Visibility number gauge using the
visibilityattribute.
All of these blocks can be added using the same steps as above but with different attributes for the data source.
If you are looking to go even further: Build another workflow to set up SMS notifications when the temperature and/or humidity goes above or below certain values.
Application Templates
In this tutorial, we created an application from the ground up. WEGnology also included application templates you can use as a starting point for your own applications.
The Weather Station Application Template provides a complete implementation of the WEGnology Walkthrough. Check out this template to see a working example of a weather station.
Each template was carefully designed to demonstrate a specific set of WEGnology’s capabilities. You can check out these templates:
- Industrial Equipment Monitor, by WEGnology: A multi-tenant equipment monitoring application with multiple customers and users.
- Asset Tracker, by WEGnology: Monitors real-time geolocation, temperature, and shock for multiple asset tracking devices.
- Huddle Room Monitor, by WEGnology: Provides real-time availability and historical occupancy data for corporate huddle rooms.
More Resources
Here are more great ways to learn about WEGnology:
Workflow Lab — The WEGnology Workflow Lab is an interactive training tool that provides a set of challenges to solve using WEGnology's Visual Workflow Engine. The Workflow Lab is intended to be used by new WEGnology Developers to grow their workflow development skills.
Was this page helpful?
Still looking for help? You can also search the WEGnology Forums or submit your question there.