GPS Heatmap
The GPS Heatmap Block shows the distribution of GPS datapoints across one or more devices. The heatmap can show historical information or the current position distribution for a set of devices.
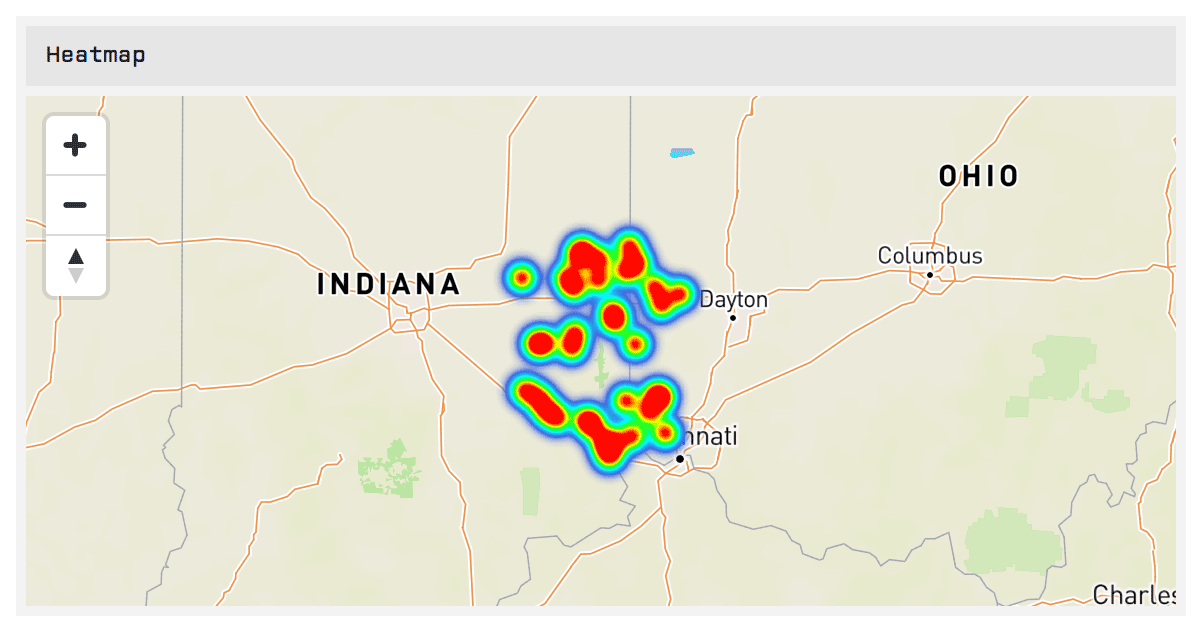
The hotter the colors, that is, the more red and orange they are, the more time your device has spent in that location over the selected duration. Cooler colors such as blue and purple show places your device has been, but for less time than the other areas.
The map automatically pans and zooms to display all the available data retrieved for the block's configuration. However, you are free to pan and zoom the map on your own.
Devices
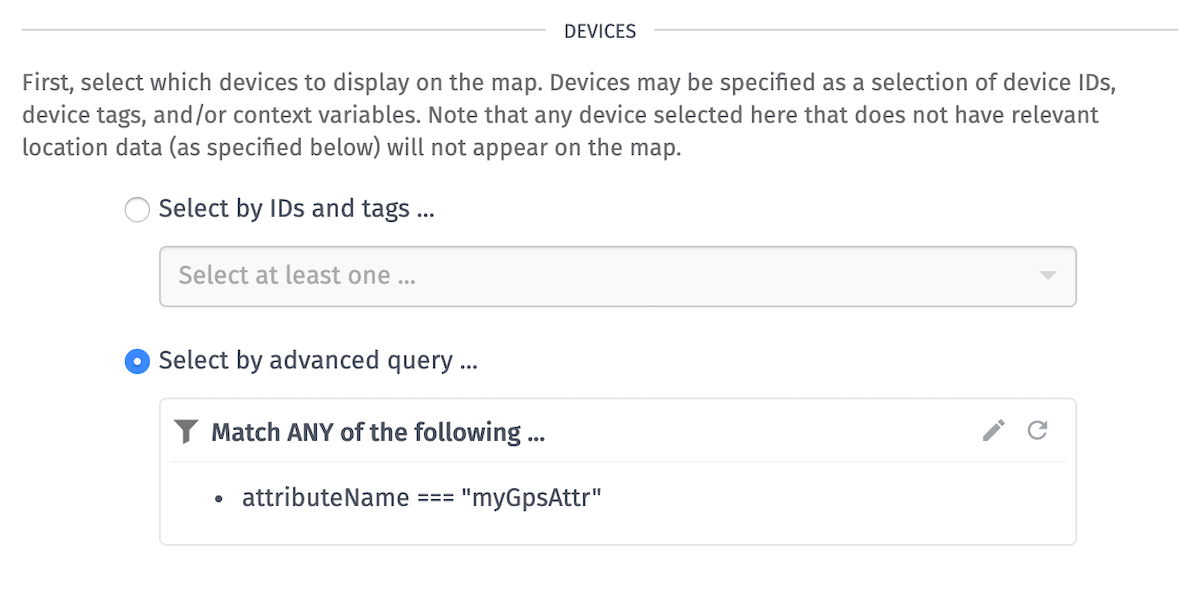
First, select one or more devices to display on the map using a device query. Any device matching the query must also have location data available through the specified data source in order for it to appear on the map.
Map Data Source and Duration
You can choose either "Populate from attribute data" or "Populate from a device tag."
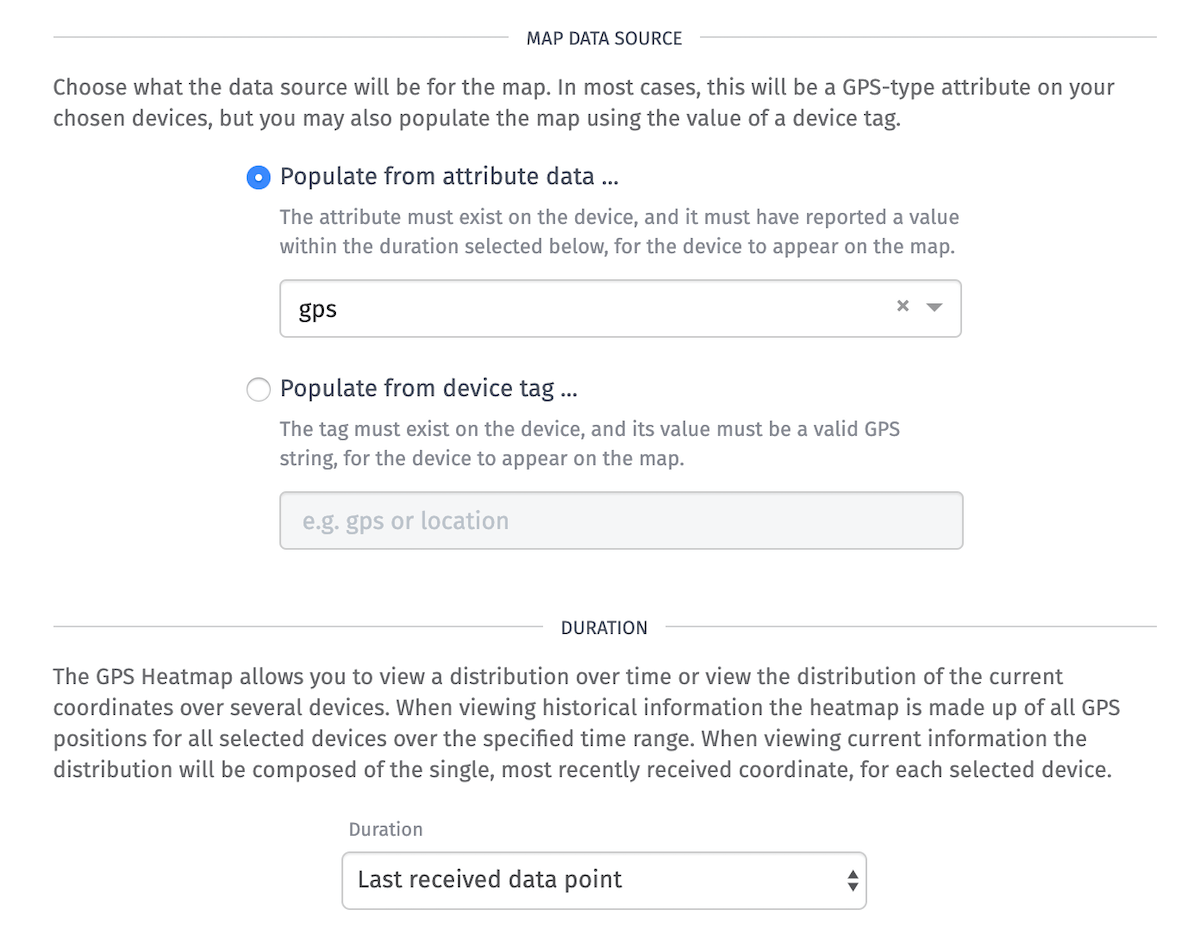
Populate from attribute data
If you use an attribute as your data source, you will also have to choose a "Duration".
To view the current location of your devices, select "Last received data point".
To view your devices' locations over a given period of time, choose any other value for duration. This will alter the map to show where your devices have been, as a percentage of time, over the given duration.
Populate from a Device Tag
If a device has a static location, you can use a device tag to represent the location of the device. In that case, you cab select a tag to represent the location of the device on the map.
The tag must exist on the device, and its value must be a valid GPS string for the device to appear on the map.
Default Viewport
Set the default viewport for the block.
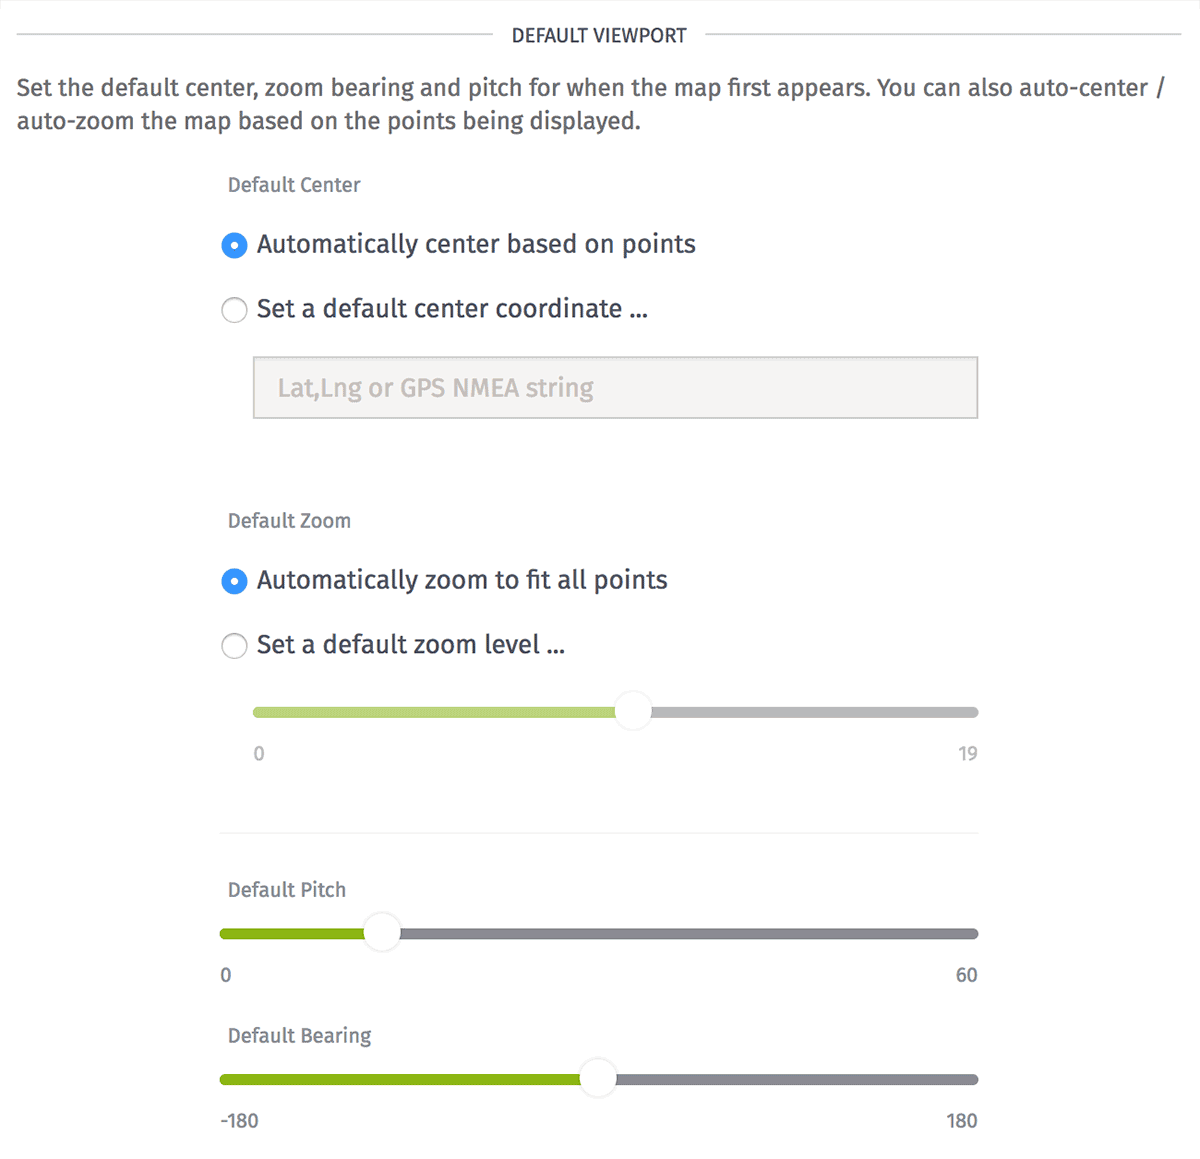
Click the "Set" button to interact with the map in the block preview and pass its settings to the block configuration.
-
Default Center: You can enter a GPS string to set the default GPS location for the map to center on. If no value is provided, the map will default to the center of the United States. Checking "Automatically center map based on points" will center the map on the data you are displaying once it has loaded.
-
Zoom: Automatically zooms the map to display all points returned by the query, or sets a manual zoom level.
-
Bearing: Sets a default bearing where
0points north to the top of the map and values between-180and180move the map in either direction. -
Pitch: Sets a default pitch for the map, between
0(straight overhead) and60degrees.
Once a user manually pans or zooms the chart in the dashboard view, the default settings are disregarded until the dashboard is reloaded.
Default Map Style
You can choose a particular default map tile set. The two current styles available are "Normal" and "Satellite."

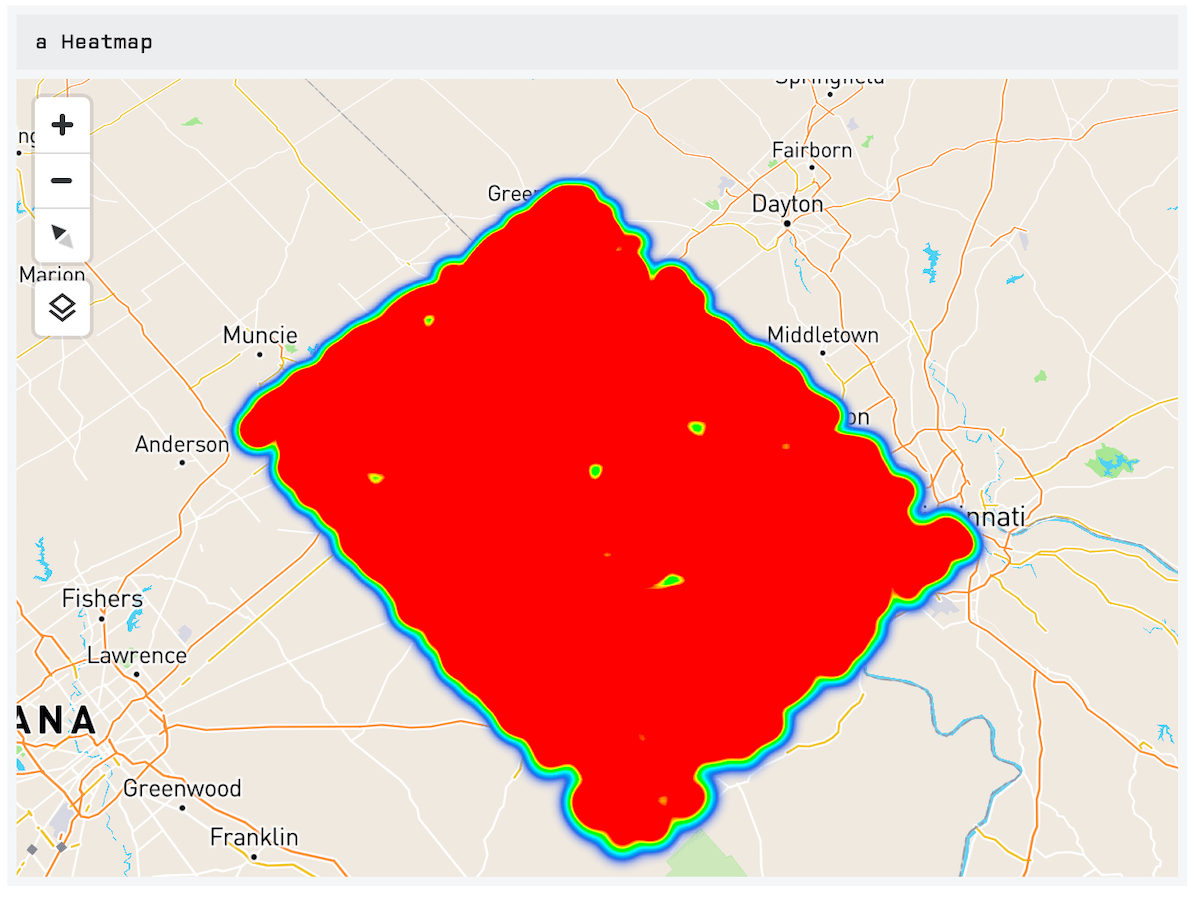
- Normal: Standard vector map with streets and labels and changes from a light to dark style depending on the theme chosen. Preview:
- Satellite: Uses satellite imagery to display the map with streets and labels overlaid on top. The Satellite style does not have themes for light or dark and remains the same no matter what theme is chosen for the dashboard. Preview:
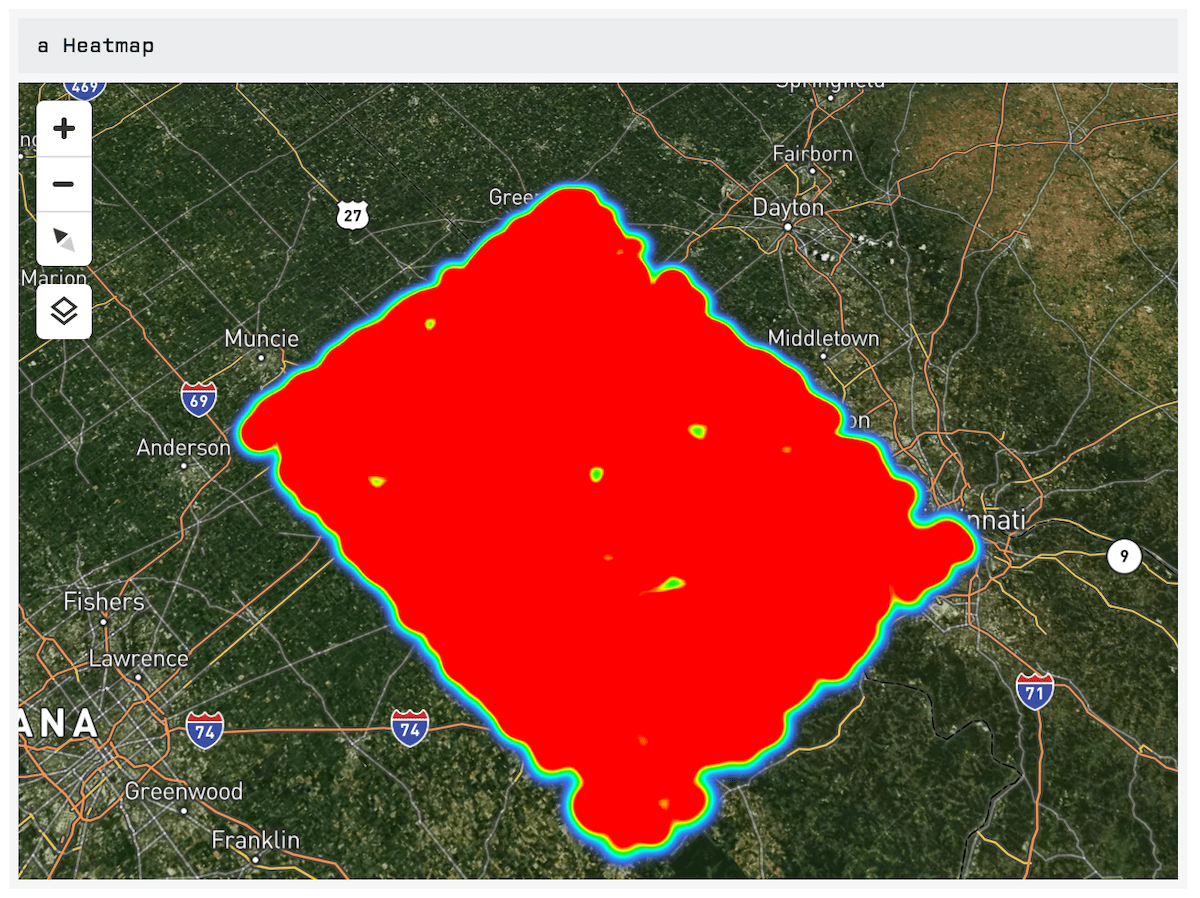
You are be able to toggle the map type from the dashboard view, but the map will always load with the default style chosen here.
Was this page helpful?
Still looking for help? You can also search the WEGnology Forums or submit your question there.