Position Chart
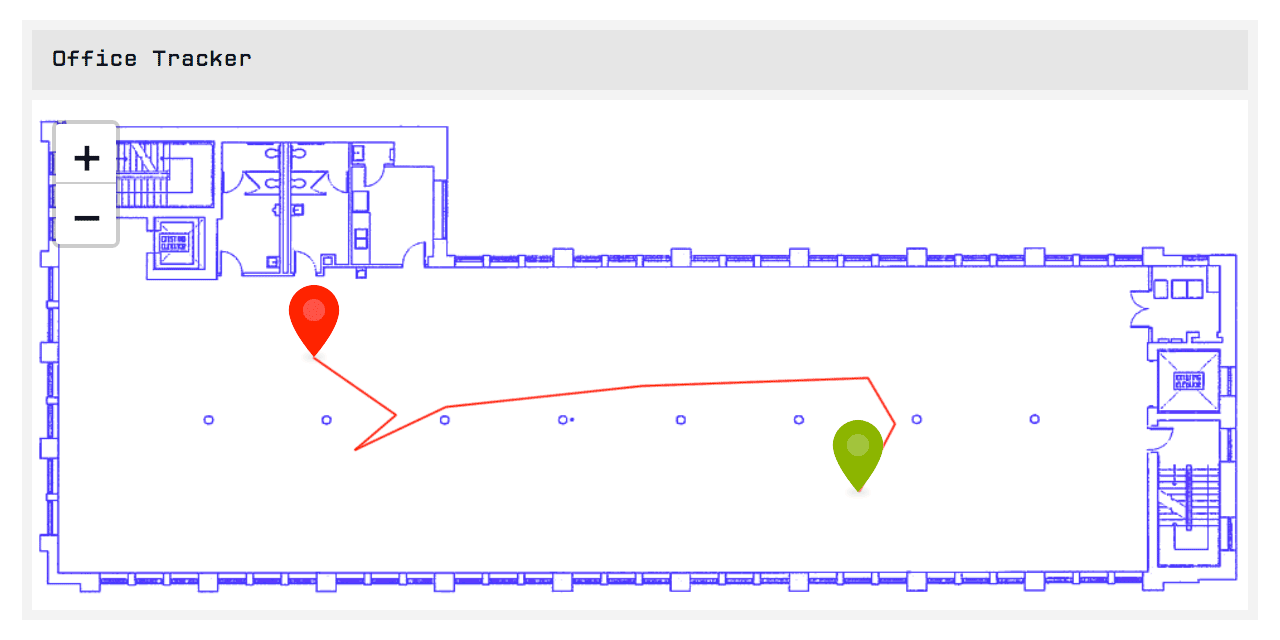
The Position Chart allows for displaying the position of devices over a custom image, such as a floorplan. The block behaves similarly to the GPS History Block with the exception of the custom image in place of the world map.
Configuration
The Position Chart configuration can be broken down into a number of sections.
Duration
Select the Duration of data you would like to display for the devices on the chart. You may select time ranges between Last received data point and 180 days. If choosing a duration other than Last received data point, the data for each device will be represented by a colored line on the chart.
You may also optionally select a Resolution to limit the number of data points returned; doing so will return the last reported position within each resolution bucket. Not setting a resolution will return all points per device within the selected
Block Data
Next, select the device(s) and attributes for which you would like to display position data.
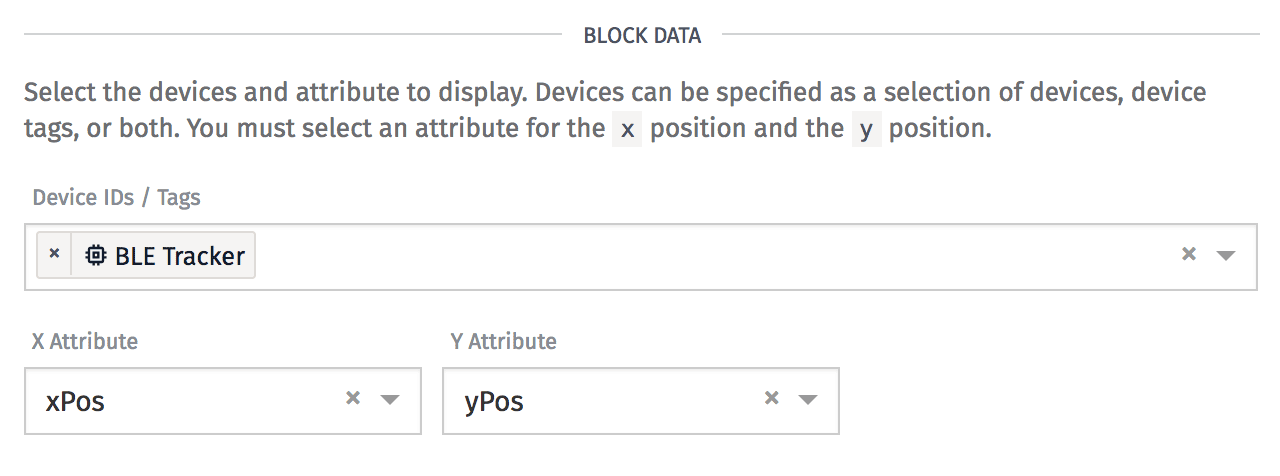
- Device: A device query for which you would like to return data. Each device that matches the query will be represented separately on the Position Chart.
- X Attribute: The attribute on the selected device(s) that corresponds to the
xposition on the chart. This attribute must be a of the "Number" type, or a context variable that resolves to a Number attribute. - Y Attribute: Similar to the X Attribute, except this represents the
yposition on the chart.
Image
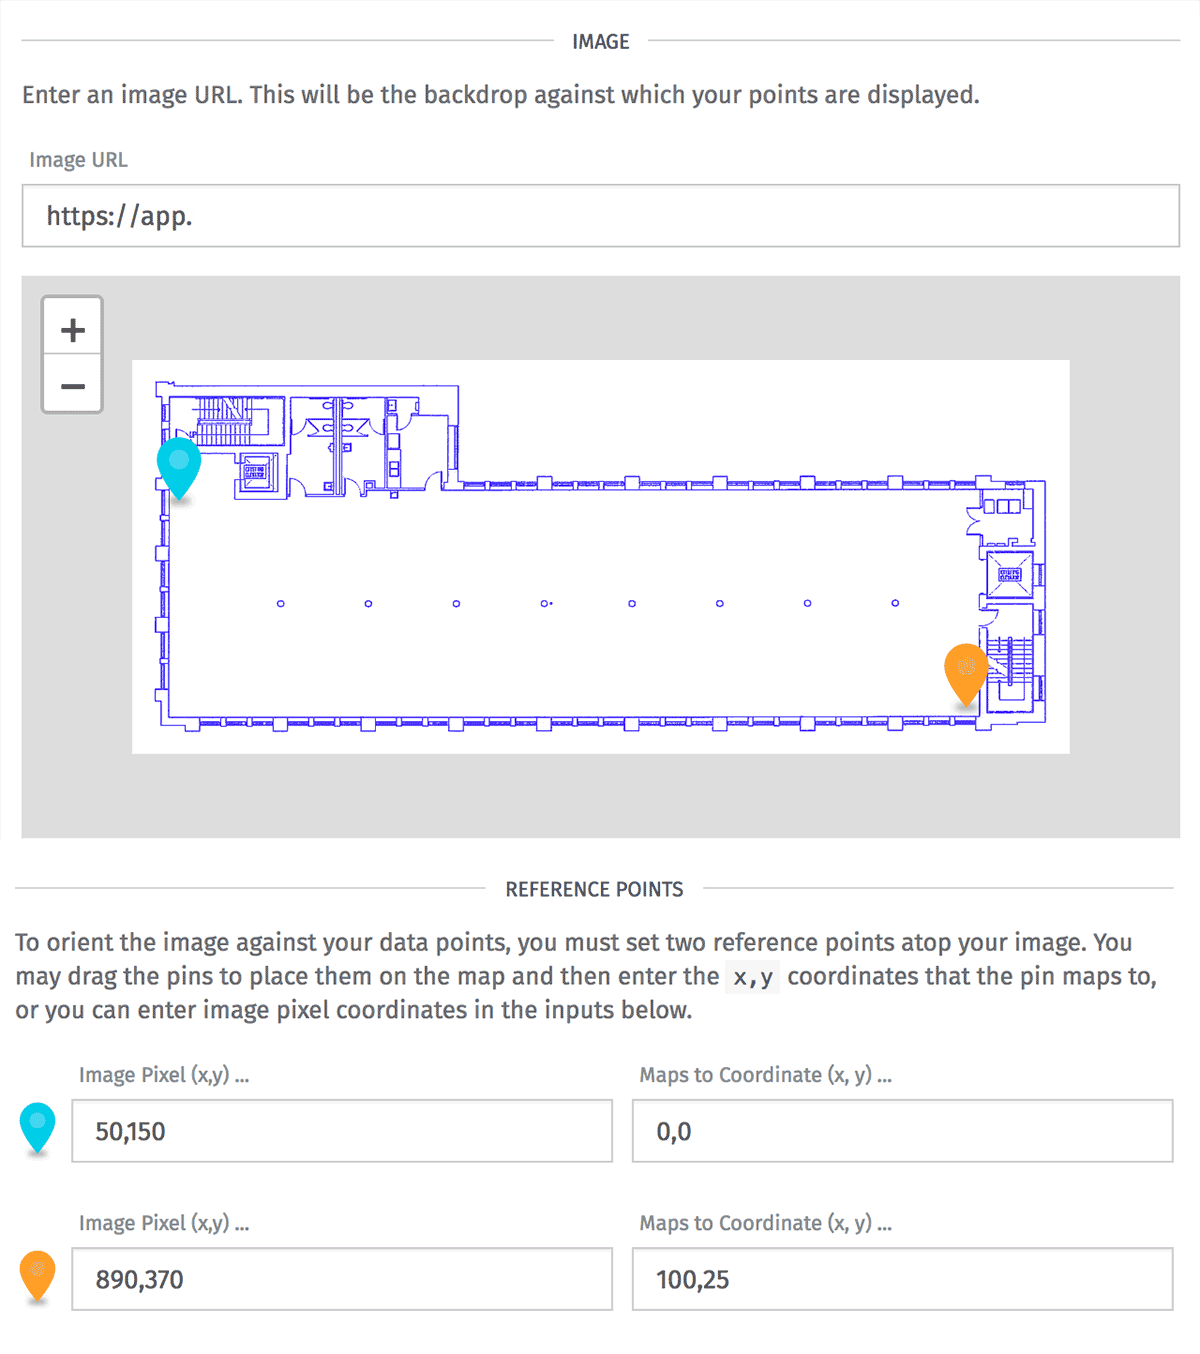
Choose the image atop which you would like to display position data. Enter an absolute URL to an image that is hosted on the service of your choosing.
The URL must resolve to an image; if it does not, the block will display an error message and position data will not be displayed within the block.
Reference Pins
Once an image has been chosen, it is necessary to set a frame of reference for how to scale and position your device data over the image. By setting two reference pins, we are able to convert your (x, y) position data into pixel positions on your image regardless of your data plane's scale or orientation.
For each reference pin, you may click and drag the pin to a spot on the image or you may manually enter a pixel position in the format x,y, where the top left corner is position 0,0 and the bottom right is the image's width,height.
Then, you must then enter the x,y coordinate that corresponds to that spot within your plane. Changing these values, or the position of the reference pins, will cause your position data to reorient.
Data Attributes
Devices that have a large number of Attributes could potentially cause the block to take a long time to load. To avoid this, you can control what Attributes the device returns along with the location data.
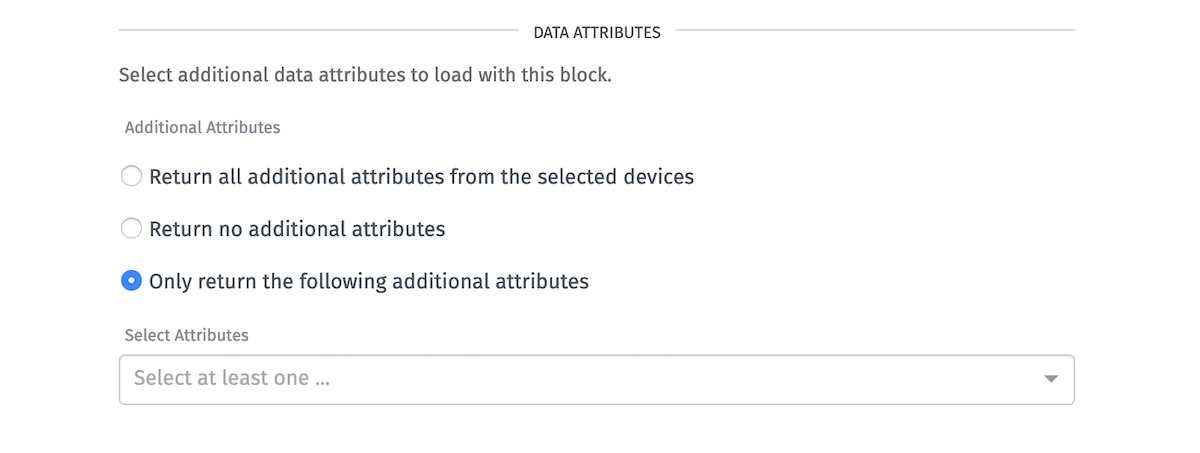
- Additional Attributes: Choose how many Attributes are returned from the selected device.
- Select Attributes: Choose specific Attributes to return from the device when "Only return the following additional attributes" is selected under "Additional Attributes".
Viewport
Set the default viewport for the block. You can also interact with the chart in the block preview and pass its settings to the block configuration by clicking the "Set" button.
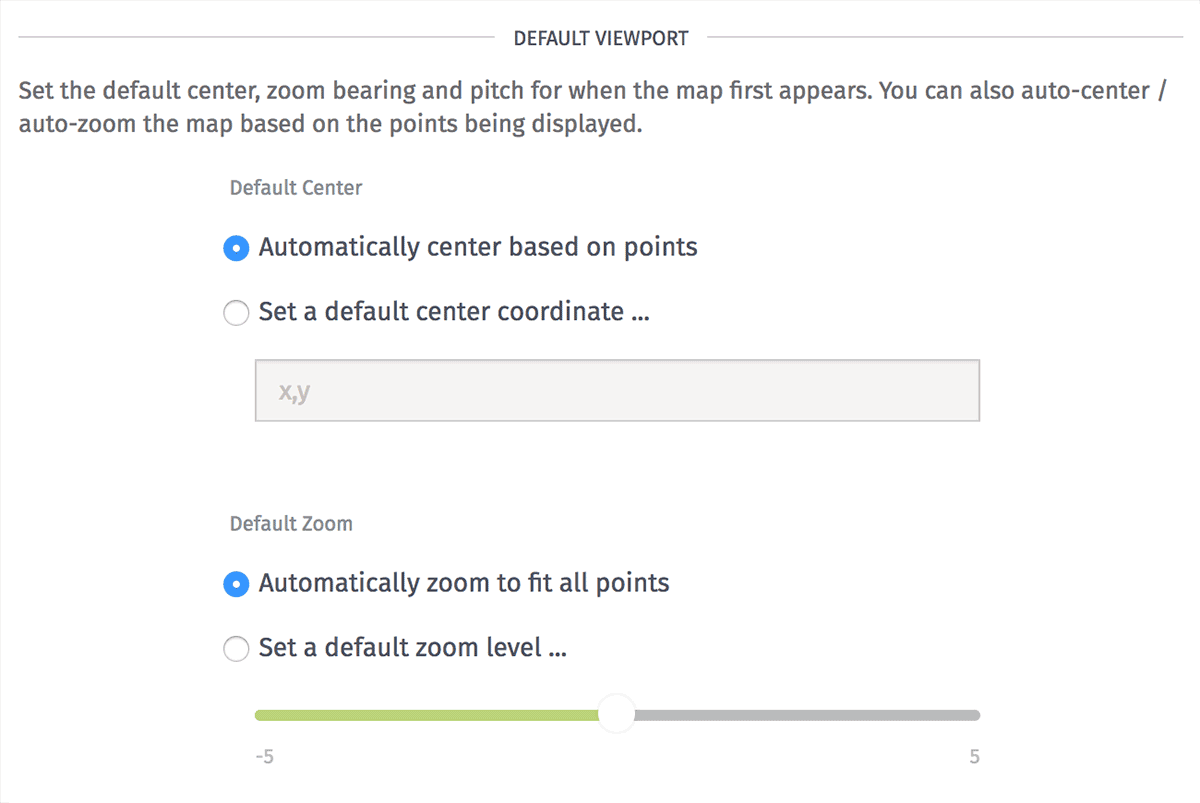
- Default Center: Sets the default x,y location for the map to center on. Checking "Automatically center map based on points" will center the map on the data you are displaying once it has loaded.
- Zoom: Automatically zoom the chart to display all points returned by the query, or set a manual zoom level. A zoom of
0displays the image at its natural size. - Disallow user zoom in/out: When checked, the zoom controls will not appear on the block and users viewing the block will not be able to alter the zoom level.
Once a user manually pans or zooms the chart in the dashboard view, the default settings are disregarded until the dashboard is reloaded.
Point Display Configuration
WEGnology allows for customization of the pins for points on the map as well as the popups that appear when clicking on a map pin.
Line Decorators
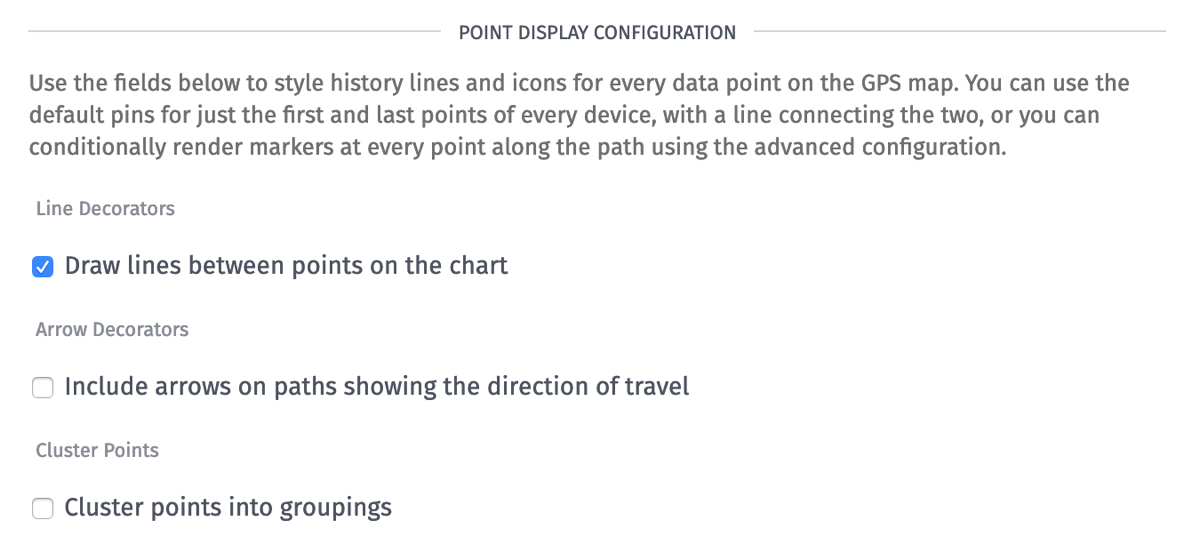
By default, WEGnology draws lines between data points on the map. You can remove these lines so that only the raw data points will be displayed.
Arrow Decorators
Optionally, if line decorators are enabled, you can enable arrow decorators to show which direction your connected device was moving along the line.
Simple Pin Style Configuration

By default, WEGnology places a red marker at the oldest (starting) point for a series and a green marker at the most recent (ending) point for a series. You can change the color and the transparency of either pin using the color picker for that pin, and the change will apply to all of the relevant start or end pins on the map.
Advanced Pin Style Configuration
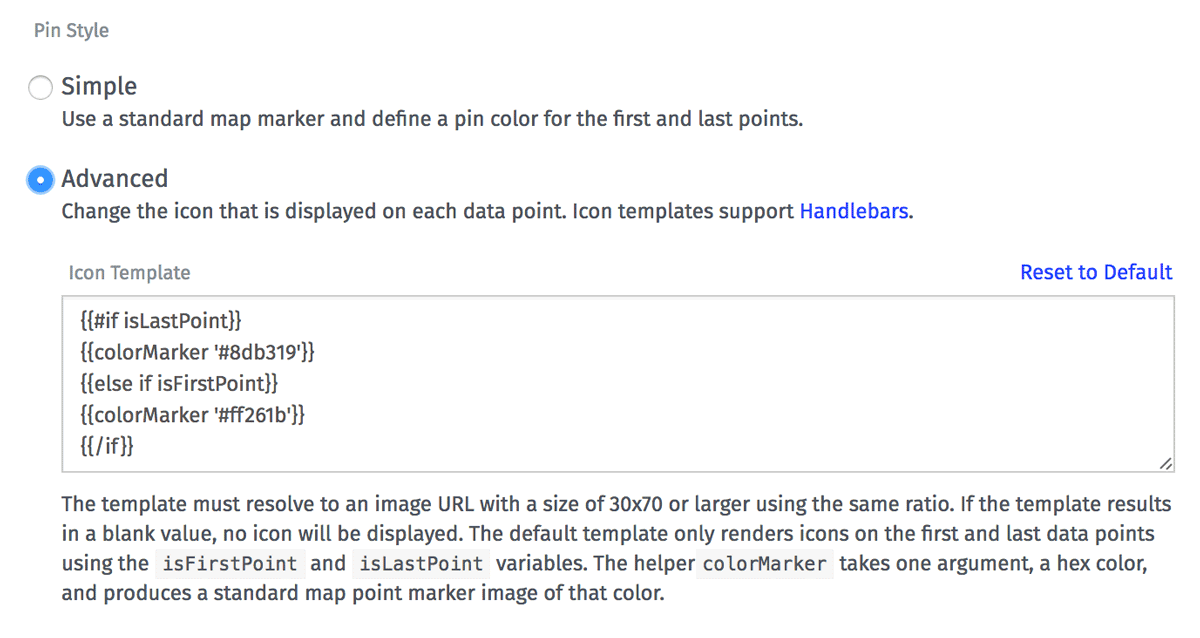
If you want more control over marker pins, you can select Advanced. Configuration is similar to advanced pin configuration in the GPS History Block.
When using the advanced mode, the following variables are available for you to use in the icon template:
isFirstPoint- True if this is the first (oldest) data point in the series.isLastPoint- True if this is the last (most recent) data point in the series.index- Index of the current data point in the series.deviceName- Name of the device that generated this data point.deviceId- Id of the device that generated this data point.deviceTags- The tags (as an object) of the device that generated this data point.x- The x position of the current data point.y- The y position of the current data point.time- Time of the current data point.data.<attributeName>- Value of given attribute at this data point.
Popup Style Configuration
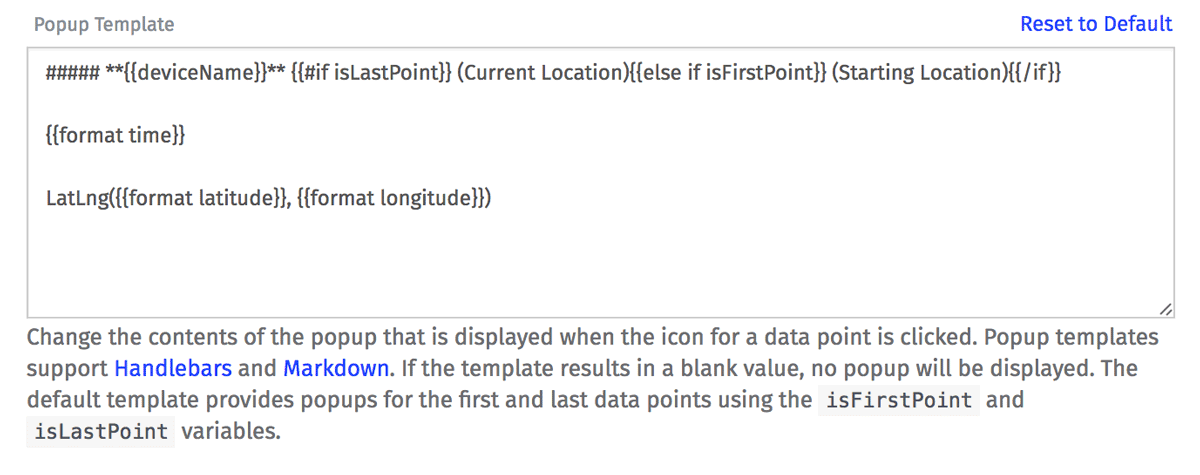
Just like the Advanced pin configuration, the popup configuration allows you to provide a string template that will
be used for rendering the popup for a point. Configuration is similar to advanced pin configuration in the GPS History Block
The same variables exposed in the advanced pin style configuration are available in the popup configuration.
Was this page helpful?
Still looking for help? You can also search the WEGnology Forums or submit your question there.