Data Explorer
The Application Data Explorer allows you to easily explore, aggregate and analyze historical data across all of the devices in an application.
The Data Explorer can be accessed through the "Data Explorer" link in the Application navigation bar:
Data Settings
There are a handful of controls available for building a data query and for exploring application data over time:

- A - Start: Controls the start of the time range of the data to display.
- B - End: Controls the end of the time range of the data to display.
- C - Back: Moves the time range back by the current time range duration. For example, if you are looking at a three-hour time range, this will move the time range into the past by three hours.
- D - Forward: Moves the time range forward by the current time range duration.
- E - Now: Moves the "End" time to the current time, and "Start" time to "now minus the current time range duration".
- F - Devices / Tags: A device query for selecting which devices to return data against. All attributes from each device that matches the query will be returned; however, the format of the returned data (and whether data even can be returned) will change depending on each attribute's type and the selected aggregation method.
- G - Aggregation: The aggregator function to use for accumulating the data into the selected resolution. Defaults to Mean (i.e., the average of all the values in a resolution window). If NONE is selected in the "Aggregation" dropdown, then all data points within the selected time range will be returned for each device. "Resolution" does not apply to unaggregated data, so that dropdown will disappear.
- H - Resolution: The size of the aggregation window, which determines how many points will be displayed for a time range. For example, a three-hour time range at five-minute resolution would have 36 data points - one for each five-minute period in those three hours.
Graphs Tab

After building your data query, the Graph tab will update to show an array of graphable attributes with "spark lines" representing a simplified version of that attribute's data over the given time period. Only attributes of the Number and Boolean types can be displayed on the cartesian grid, unless Count is the chosen aggregation. In that case, the number of times String and GPS attributes are reported per resolution period will also be displayed on the graph.
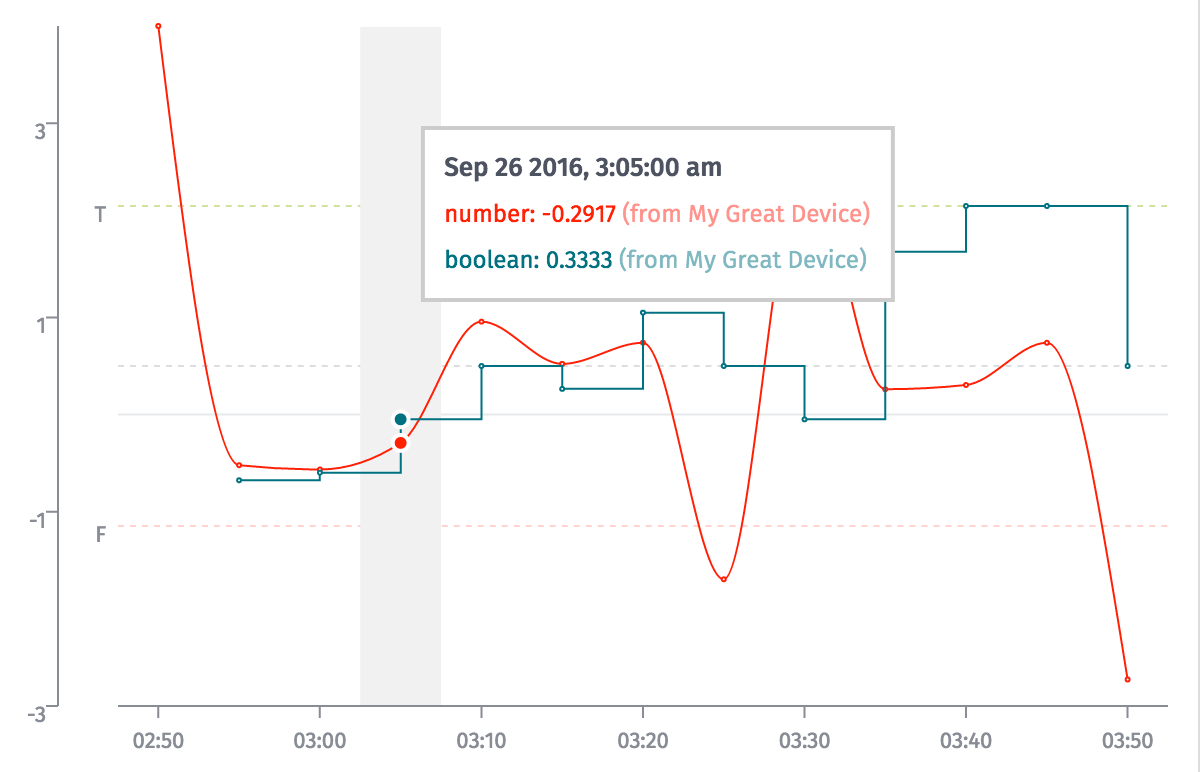
Hovering your mouse over the main graph will display a tooltip with the exact value of each graphed attribute at that time.
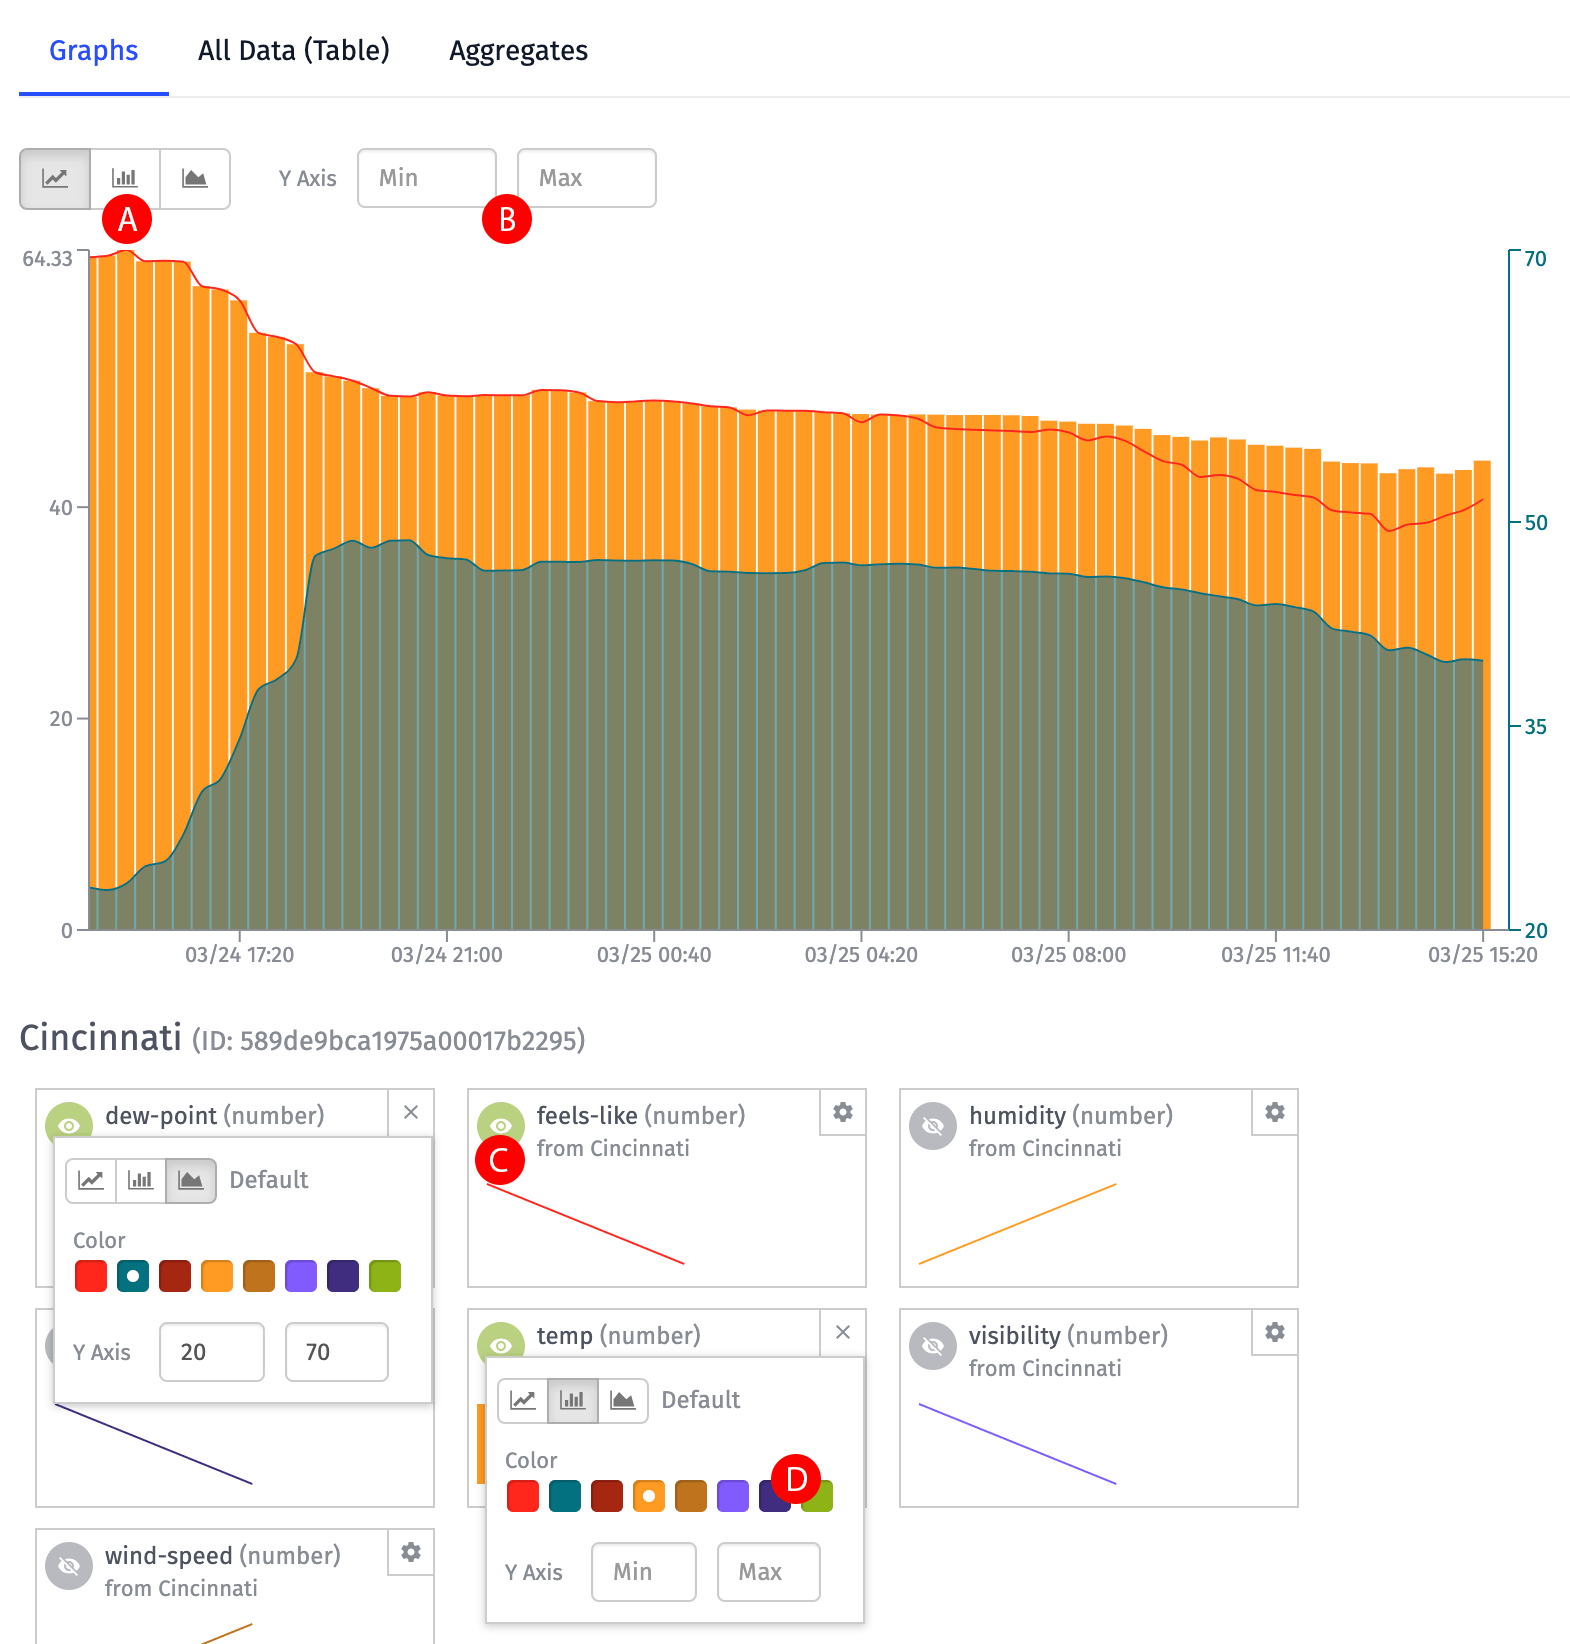
The Graphs Tab, as well as the individual attributes within the tab, have a handful of configuration settings:
- A - Graph Type: Segments can be displayed as a line graph, a bar chart or an area chart. This can be set as the default across all selected attributes, and that default setting can be overridden per attribute.
- B - Y Axis Domain: Leave the min and max inputs blank to automatically calculate the graph size based on the data returned. However, if you'd like to set a custom min and/or max data range, enter a numeric value in the input(s). These values can also be overridden per attribute.
- C - Toggle Visibility: Toggle the eyeball icon to display or hide the given attribute in the main graph.
- D - Color: Each attribute is automatically assigned a color, but that color can be overridden by the user.
To change graph settings for a single attribute, click the gear icon in the top right corner of the attribute box. This will display a dropdown menu for editing that attribute's settings.
Graph Limits
There is a limit to the number of points that may be graphed at one time before web browsers struggle with the data load. If your query returns more points than can be graphed, you will be asked to reduce your time range, increase your resolution or display fewer attributes.
Boolean Attributes

In the case where a Boolean attribute it being graphed, and the selected aggregation method is not Sum or Count, the attribute's graph follows a special stepped layout. It is still possible to change the attribute's color, but the Graph Type and Y Axis Domain cannot be overridden.
All Data Tab

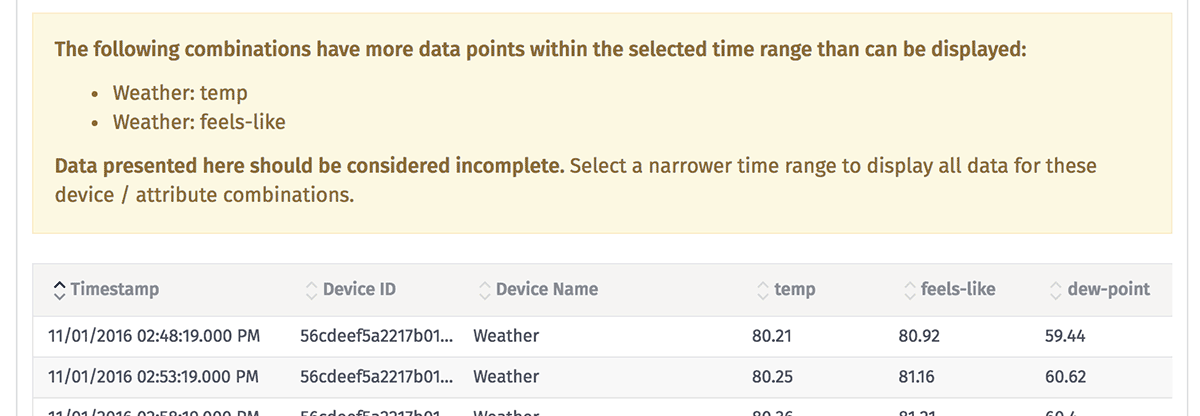
The "All Data" tab shows all returned data points for your query – all device / attribute combinations, timestamps and the values per attribute – in a sortable table. Number and Boolean attributes will return data for any aggregation method; GPS and String attributes will only return data for "Count", "First" and "Last" aggregations.
If "NONE" is the chosen aggregation method, there is a limit to the number of points that can be returned per device / attribute combination. Should you run up against this limitation, you will have to narrow your query's time range to ensure you are receiving all data points.

Note that the table is scrollable vertically (for large date ranges and/or small resolutions) and horizontally (for large numbers of attributes).
It is also possible to export the data table as a CSV by clicking the button in the top right corner of the tab.
Aggregates Tab

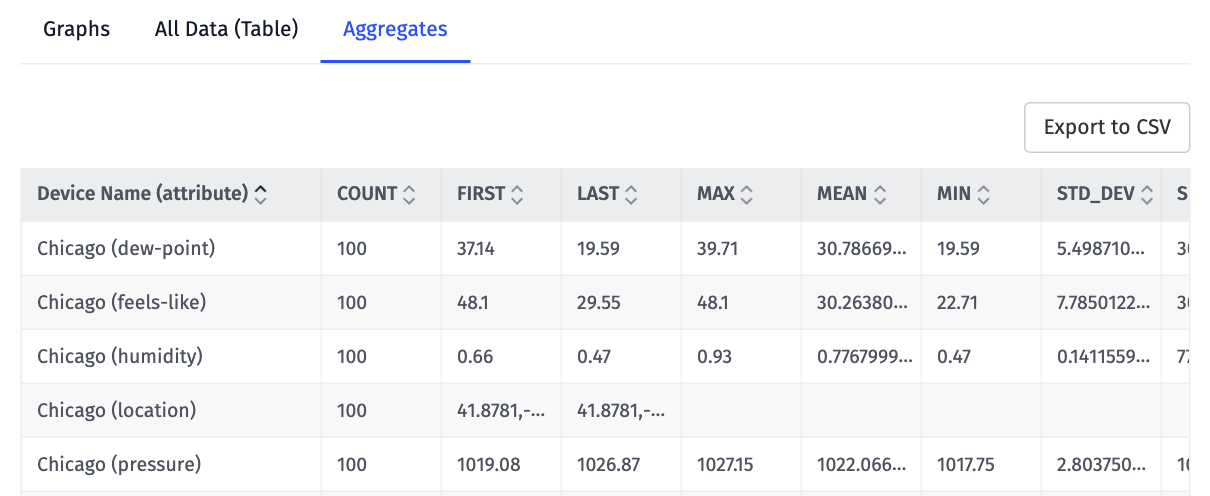
The "Aggregates" tab shows the aggregate values of each device/attribute combination over the given time period. This is the equivalent of the resolution being set to the same as the start to end duration, thus only one data point is returned for each combination.
Number and Boolean attributes return data for any aggregation method.
GPS and String attributes only return data for "Count," "First," "Last," and "Time at Value" aggregations.
Like the "All Data" tab, this table can also be exported as a CSV.
Aggregation Types
In most places, you use aggregations with a Device Query to access your data.
Was this page helpful?
Still looking for help? You can also search the WEGnology Forums or submit your question there.